INVITE-ONLY SCRIPT
High Time Frame Candles [TakingProphets]
High Time Frame Candles [TakingProphets]
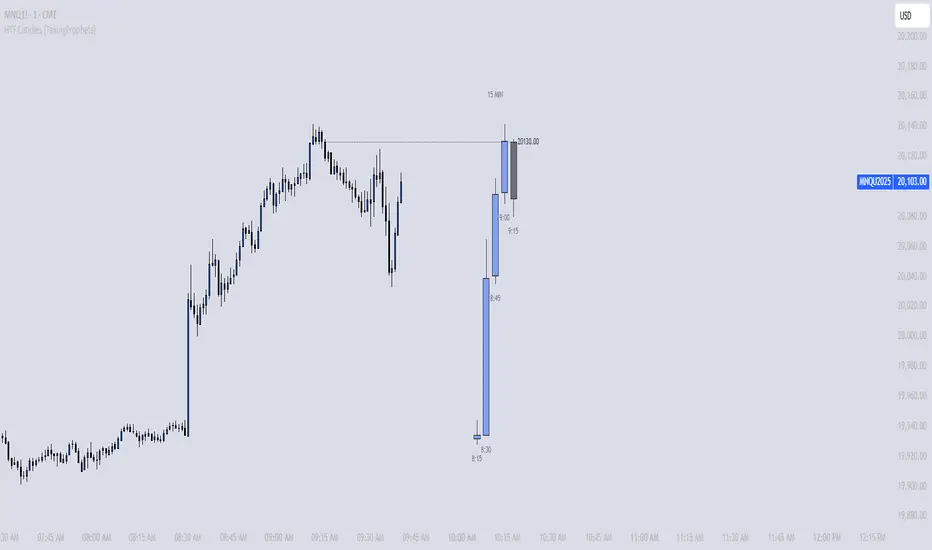
Stay aligned with institutional context by visualizing higher timeframe (HTF) candles directly on your lower timeframe chart. This tool combines HTF structure, SMT divergence detection, and real-time projections of Open, High, Low, and Close levels — all in a clean, customizable package.
What It Does
🟩 Plots HTF Candles — See up to 10 higher timeframe candles rendered on your chart, offset to the right for a clutter-free view.
⏱️ HTF Close Timer — Know exactly when the current HTF candle is about to close.
🔀 SMT Divergence Detection — Automatically highlights bearish or bullish SMT setups by comparing your chart against a correlated instrument (default: CME_MINI:ES1!).
📊 Real-Time Projections — Projects the current HTF candle’s Open, High, Low, and Close levels forward, with optional price labels for precision trading.
Key Features
🎛 Configurable Candle Rendering
Adjustable width, transparency, offsets, colors, and label sizes.
Choose any HTF — from 1 minute to 1 month.
🕒 Custom Time Labels
Displays HH:MM timestamps for intraday or dates for higher frames.
Supports both 12-hour and 24-hour formats.
🔍 Smart Money Divergence (SMT)
Detects historical and real-time SMT setups automatically.
Optional labels, fully customizable colors, line styles, and widths.
Comes with built-in alert conditions for instant notifications.
📈 HTF Candle Projections
Draws Open, High, Low, and Close levels from the start of the current HTF period.
Labels price points with customizable sizes, colors, and styles.
Inputs Overview
Timeframe Settings → Select the HTF for plotting.
Display Settings → Number of candles, offset, width, transparency, time labels, and size.
Visual Settings → Custom bullish/bearish colors, borders, and wick styles.
SMT Settings → Enable SMT, choose correlated asset, tweak colors, lines, and alerts.
Projection Settings → Toggle Open/High/Low/Close projections, customize line styles, widths, and labels.
Alerts 🔔
Built-in alerts let you stay ahead of SMT divergence in real-time:
Bullish SMT → Divergence detected between main and correlated asset lows.
Bearish SMT → Divergence detected between main and correlated asset highs.
Bullish Real-Time SMT → Live SMT divergence forming.
Bearish Real-Time SMT → Live SMT divergence forming.
Pro Tips
⚡ Best used on lower timeframe charts to see HTF structure while trading intraday setups.
🎯 Keep displayed candles limited (e.g., 3–6) for cleaner visuals and better performance.
🔗 Ensure your correlated SMT symbol has real-time data access on TradingView for accurate comparisons.
僅限邀請腳本
只有經作者批准的使用者才能訪問此腳本。您需要申請並獲得使用權限。該權限通常在付款後授予。如欲了解更多詳情,請依照以下作者的說明操作,或直接聯絡TakingProphets。
除非您完全信任其作者並了解腳本的工作原理,否則TradingView不建議您付費或使用腳本。您也可以在我們的社群腳本中找到免費的開源替代方案。
作者的說明
ACCESS THROUGH TAKINGPROPHETS.COM or DM me !
提醒:在請求訪問權限之前,請閱讀僅限邀請腳本指南。
免責聲明
這些資訊和出版物並不意味著也不構成TradingView提供或認可的金融、投資、交易或其他類型的意見或建議。請在使用條款閱讀更多資訊。