PROTECTED SOURCE SCRIPT
ストップ高背景
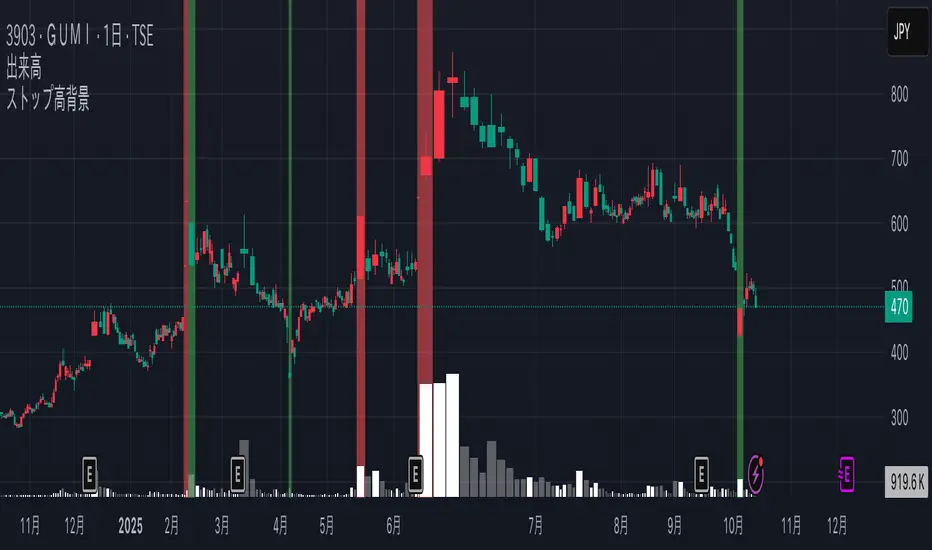
🟥 ストップ高・ストップ安を背景色で一目表示
このインジケーターは、日本株の「値幅制限(ストップ高・ストップ安)」を自動計算し、
当日の高値がストップ高に達したバーは背景を赤色、安値がストップ安に達したバーは背景を緑色で表示します。
煩雑な価格帯の計算をせずとも、チャート上で一目で「ストップ高・ストップ安に到達したか」を把握できます。
📝 仕様・ロジック
前日の終値から、東証の値幅制限ルールに基づいてストップ高/ストップ安価格を自動計算
高値がストップ高に一致 → 背景が赤
安値がストップ安に一致 → 背景が緑
値幅制限は価格帯ごとの公式基準に対応(30円〜1000万円超まで網羅)
📈 対応市場・おすすめの使い方
対象:日本株(東証グロース/プライム/スタンダード)
推奨時間足:日足(寄り付き〜引けの動きを見る際は5分足や30分足も有効)
ストップ高張り付き銘柄の出来高推移や引け際の動きの確認に便利です
⚠️ 注意点
売買高や張り付き時間などの情報はTradingViewでは取得できないため、本インジケーターでは価格の一致によって到達判定を行っています。
4倍値幅(例:IPO・新規上場2日目や特定の急騰時など)には対応していません。
値幅制限ルールが変更された場合は更新が必要になる場合があります。
📌 ストップ高・ストップ安を「背景色」で直感的に把握できるので、仕込み・監視・利確判断の補助ツールとしてご活用ください!
🟥 Instantly Spot Limit-Up / Limit-Down Days with Background Colors
This indicator automatically calculates daily price limits (limit-up / limit-down) for Japanese stocks.
When the day’s high reaches the limit-up price, the background turns red.
When the day’s low hits the limit-down price, the background turns green.
This allows you to visually identify limit-up or limit-down days at a glance, without manually calculating price bands.
📝 How It Works
Calculates limit-up and limit-down prices based on the previous day’s close and the Tokyo Stock Exchange’s official price limit rules
High equals limit-up → Red background
Low equals limit-down → Green background
Fully supports the official TSE price limit tiers, covering a wide range (from ¥30 up to over ¥10,000,000)
📈 Supported Markets & Recommended Usage
Markets: Japanese equities (TSE Growth / Prime / Standard)
Recommended timeframes: Daily (also effective on intraday charts such as 5m or 30m for monitoring intraday moves)
Useful for checking volume trends and price behavior near the close on stocks that have hit their limit-up.
⚠️ Notes
TradingView does not provide data such as trading volume at limit price or time spent at limit, so this indicator detects limit-up/down purely by price matching.
4x price limits (e.g., on IPOs, the 2nd day of listing, or certain extreme rallies) are not supported.
If the official TSE price limit rules change, the indicator may need to be updated accordingly.
📌 This tool helps you visually track limit-up and limit-down situations, making it handy for entry planning, monitoring, and profit-taking decisions.
受保護腳本
此腳本以閉源形式發佈。 不過,您可以自由且不受任何限制地使用它 — 在此處了解更多資訊。
免責聲明
這些資訊和出版物並不意味著也不構成TradingView提供或認可的金融、投資、交易或其他類型的意見或建議。請在使用條款閱讀更多資訊。
免責聲明
這些資訊和出版物並不意味著也不構成TradingView提供或認可的金融、投資、交易或其他類型的意見或建議。請在使用條款閱讀更多資訊。