PROTECTED SOURCE SCRIPT
SUPER EMA SMA 16x [GUSLM]
█ Author's Note:
After extensively reviewing the EMA and SMA consolidation tools in the TradingView library, I found that none fully met my expectations or those of friends and colleagues. Some tools were too specific or not configurable enough, with varying sensitivities. Others lacked options or produced many invalid and incorrect ranges when viewed across different timeframes. Some were fixed in their options, others did not allow visualization on different timeframes or lacked crossover signals and customization options for turning each option on or off. Additionally, there was no custom function to view one or more configurable moving averages from different timeframes in the current view, serving as a time-saving shortcut to avoid switching between timeframes to record values. Consequently, I decided to develop my own tool. I hope that you, fellow traders, find it valuable and enjoy using it.
█ Description:
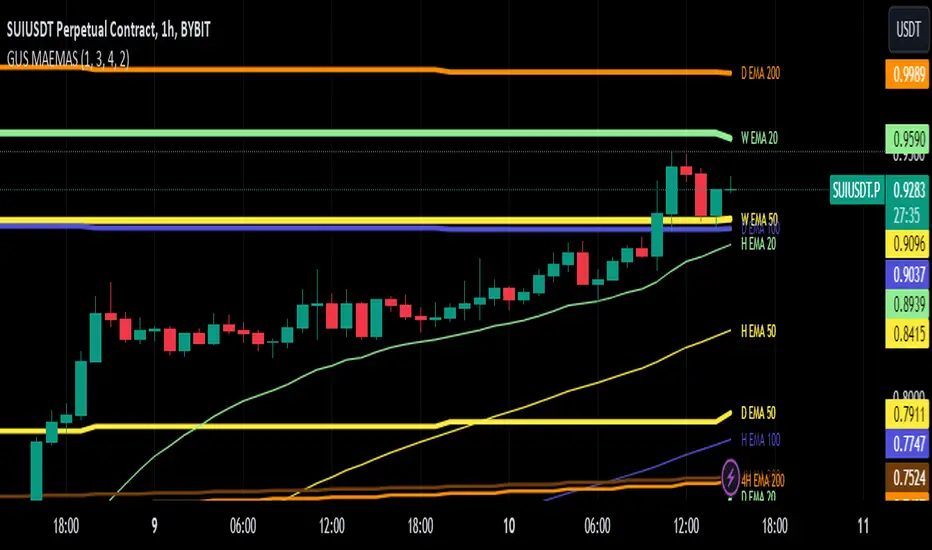
The GUSLM SUPER EMA SMA 16x allows traders to configure and visualize multiple labeled trendlines for various periods on a single chart, all at once. highlighting how prices move over time. It enables simultaneous display of trendlines for different timeframes, with customizable colors and thicknesses. Designed for traders who use moving averages in their strategies, it simplifies the analysis of key moving averages like the 200-period, 100 50 12 26 and 20-period etc, offering a clear, configurable tool to try to identify reactions, trends, supports, and resistances.. This indicator employs algorithms to detect and show signals where price movements are confined, all that can be usefull for helping traders spot potential breakout zones and make informed trading decisions.
█ Key Features:
► Customizable Timeframes: Display in one, multiple moving averages and exponential moving averages across various timeframes (weekly, daily, hourly, and 4-hour) to tailor analysis to your trading strategy.
► Adjustable Display Settings: Choose which moving averages to display and customize their visual characteristics, including color and line width, to match your chart preferences.
► Dynamic Alerts: Activate signals for different timeframes with customizable visual cues, including background color changes and shape indicators to highlight key trading signals.
► Clear Visual Indicators: Enhance chart readability with distinct colors and shapes for different types of moving averages and also crossover events, providing immediate visual feedback for trading decisions.
█ User-Defined Inputs:
► Moving Averages Display Options:
Weekly: MA 200, EMA 200, EMA 100, EMA 50, EMA 20, EMA 12, EMA 26
Daily: MA 200, EMA 200, EMA 100, EMA 50, EMA 20, EMA 12, EMA 26
Hourly: MA 200, EMA 200, EMA 100, EMA 50, EMA 20, EMA 12, EMA 26
4-Hour: MA 200, EMA 200, EMA 100, EMA 50, EMA 20, EMA 12, EMA 26
► Line Width Adjustments:
Hourly, Daily, Weekly, 4-Hour
► Color Options for each range and or individually
► Options for type and Signal; Weekly: On/Off Daily: On/Off Hourly: On/Off 4-Hour: On/Off
► Background color change and arrow shapes for crossover and crossunder signals
█ How It Works:
► Range Detection: The indicator scans the charts in different timeframes of the same asset, based on options, and plot them on the actual view, even if they are from another timeframe. And label it based on configuration, telling wich one is from where as H 4h W etc, and its lenght and range. also for collors widths etc. It calculates the average or exponential average price from other timeframes, and plot it in the current view.
► Visualization: Validated ranges and lines are highlighted on the chart with colored optimized lines, providing a clear visual cue of potential zones.
█ Usage Examples:
► Example 1:
You can configure the ranges you want and timeframes you want and see how it interact with the prices. and can expect eventual future reactions.
https://www.tradingview.com/chart/BTCUSDT/sJ108Kjz-Ex-Averages-interactions/
█ Practical Applications:
► Identify and Confirm Breakout Zones: Use the lines to identify potential breakout zones and limits, Ex: if is there a key level above your breakout, you may expect a reaction, maybe changing your plan to make an entrance above the initial resistance, you can see eventual resistance and support zones. helping to anticipate significant price movements.
► Identify Key Price Levels: The tool helps in pointing key price levels where there is a high probability of significant price reactions, providing crucial insights for trading strategies.
► Enhance Technical Analysis: Integrate the SUPER EMA SMA 16x into your existing technical analysis toolkits to improve the accuracy of your trading decisions.
█ Conclusion:
The SUPER EMA SMA 16x is a powerful tool, for traders looking to identify periods of price consolidation, support and resistance levels and potential confirmation for breakout zones. Serving as a time-saving shortcut with its customizable settings and algorithms, it provides a reliable and visual method to enhance your trading strategy. Whether you're a beginner or an experienced trader, this indicator can add significant value to your technical analysis.
█ Cautionary Note:
While the SUPER EMA SMA 16x is a powerful tool to see many relevant SMAS and EMAS and signals, it's important to combine it with other indicators and analysis methods for comprehensive trading decisions. Always consider market context and external factors when interpreting detected consolidation ranges.
After extensively reviewing the EMA and SMA consolidation tools in the TradingView library, I found that none fully met my expectations or those of friends and colleagues. Some tools were too specific or not configurable enough, with varying sensitivities. Others lacked options or produced many invalid and incorrect ranges when viewed across different timeframes. Some were fixed in their options, others did not allow visualization on different timeframes or lacked crossover signals and customization options for turning each option on or off. Additionally, there was no custom function to view one or more configurable moving averages from different timeframes in the current view, serving as a time-saving shortcut to avoid switching between timeframes to record values. Consequently, I decided to develop my own tool. I hope that you, fellow traders, find it valuable and enjoy using it.
█ Description:
The GUSLM SUPER EMA SMA 16x allows traders to configure and visualize multiple labeled trendlines for various periods on a single chart, all at once. highlighting how prices move over time. It enables simultaneous display of trendlines for different timeframes, with customizable colors and thicknesses. Designed for traders who use moving averages in their strategies, it simplifies the analysis of key moving averages like the 200-period, 100 50 12 26 and 20-period etc, offering a clear, configurable tool to try to identify reactions, trends, supports, and resistances.. This indicator employs algorithms to detect and show signals where price movements are confined, all that can be usefull for helping traders spot potential breakout zones and make informed trading decisions.
█ Key Features:
► Customizable Timeframes: Display in one, multiple moving averages and exponential moving averages across various timeframes (weekly, daily, hourly, and 4-hour) to tailor analysis to your trading strategy.
► Adjustable Display Settings: Choose which moving averages to display and customize their visual characteristics, including color and line width, to match your chart preferences.
► Dynamic Alerts: Activate signals for different timeframes with customizable visual cues, including background color changes and shape indicators to highlight key trading signals.
► Clear Visual Indicators: Enhance chart readability with distinct colors and shapes for different types of moving averages and also crossover events, providing immediate visual feedback for trading decisions.
█ User-Defined Inputs:
► Moving Averages Display Options:
Weekly: MA 200, EMA 200, EMA 100, EMA 50, EMA 20, EMA 12, EMA 26
Daily: MA 200, EMA 200, EMA 100, EMA 50, EMA 20, EMA 12, EMA 26
Hourly: MA 200, EMA 200, EMA 100, EMA 50, EMA 20, EMA 12, EMA 26
4-Hour: MA 200, EMA 200, EMA 100, EMA 50, EMA 20, EMA 12, EMA 26
► Line Width Adjustments:
Hourly, Daily, Weekly, 4-Hour
► Color Options for each range and or individually
► Options for type and Signal; Weekly: On/Off Daily: On/Off Hourly: On/Off 4-Hour: On/Off
► Background color change and arrow shapes for crossover and crossunder signals
█ How It Works:
► Range Detection: The indicator scans the charts in different timeframes of the same asset, based on options, and plot them on the actual view, even if they are from another timeframe. And label it based on configuration, telling wich one is from where as H 4h W etc, and its lenght and range. also for collors widths etc. It calculates the average or exponential average price from other timeframes, and plot it in the current view.
► Visualization: Validated ranges and lines are highlighted on the chart with colored optimized lines, providing a clear visual cue of potential zones.
█ Usage Examples:
► Example 1:
You can configure the ranges you want and timeframes you want and see how it interact with the prices. and can expect eventual future reactions.
https://www.tradingview.com/chart/BTCUSDT/sJ108Kjz-Ex-Averages-interactions/
█ Practical Applications:
► Identify and Confirm Breakout Zones: Use the lines to identify potential breakout zones and limits, Ex: if is there a key level above your breakout, you may expect a reaction, maybe changing your plan to make an entrance above the initial resistance, you can see eventual resistance and support zones. helping to anticipate significant price movements.
► Identify Key Price Levels: The tool helps in pointing key price levels where there is a high probability of significant price reactions, providing crucial insights for trading strategies.
► Enhance Technical Analysis: Integrate the SUPER EMA SMA 16x into your existing technical analysis toolkits to improve the accuracy of your trading decisions.
█ Conclusion:
The SUPER EMA SMA 16x is a powerful tool, for traders looking to identify periods of price consolidation, support and resistance levels and potential confirmation for breakout zones. Serving as a time-saving shortcut with its customizable settings and algorithms, it provides a reliable and visual method to enhance your trading strategy. Whether you're a beginner or an experienced trader, this indicator can add significant value to your technical analysis.
█ Cautionary Note:
While the SUPER EMA SMA 16x is a powerful tool to see many relevant SMAS and EMAS and signals, it's important to combine it with other indicators and analysis methods for comprehensive trading decisions. Always consider market context and external factors when interpreting detected consolidation ranges.
受保護腳本
此腳本以閉源形式發佈。 不過,您可以自由且不受任何限制地使用它 — 在此處了解更多資訊。
免責聲明
這些資訊和出版物並不意味著也不構成TradingView提供或認可的金融、投資、交易或其他類型的意見或建議。請在使用條款閱讀更多資訊。
受保護腳本
此腳本以閉源形式發佈。 不過,您可以自由且不受任何限制地使用它 — 在此處了解更多資訊。
免責聲明
這些資訊和出版物並不意味著也不構成TradingView提供或認可的金融、投資、交易或其他類型的意見或建議。請在使用條款閱讀更多資訊。