PROTECTED SOURCE SCRIPT
TrendVortex Power

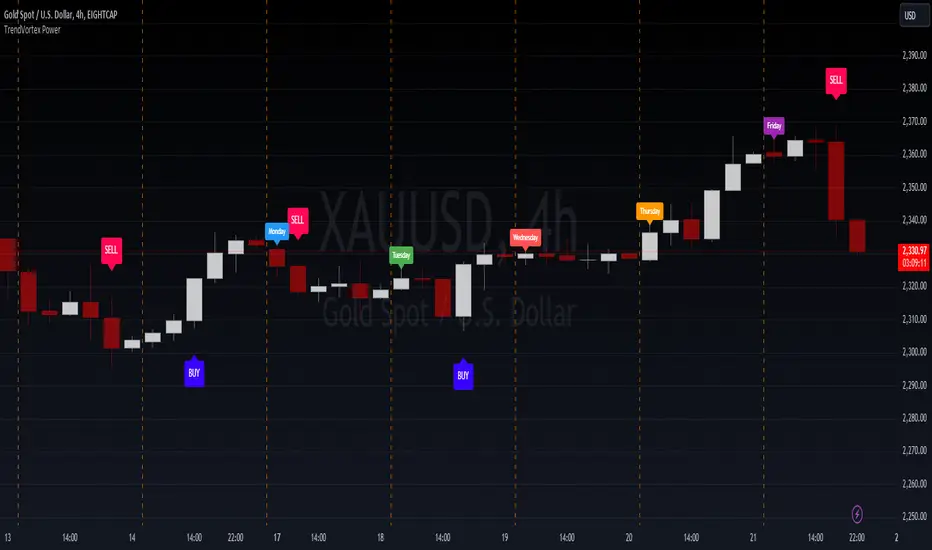
This Pine Script indicator in TradingView creates weekly labels for each trading day (Monday to Friday) and generates buy/sell signals based on a swing calculation:
Weekday Labels
Purpose: Labels each trading day of the week with different colors.
Implementation:
Initializes variables for labels (mondayLabel, tuesdayLabel, etc.).
Uses dayofweek function to determine the current day of the week.
Checks if the current day is different from the previous day to avoid redundant label creation.
Creates labels using label.new function with appropriate colors based on the day of the week.
Buy and Sell Signals:
Purpose: Identifies buy and sell signals based on swing high and swing low points.
Implementation:
Uses a specified number of bars (no) to determine swing highs (res) and lows (sup).
Determines the direction (avd) based on whether the close is above the previous swing high or below the previous swing low.
Tracks the last non-zero direction change (avn).
Calculates the trailing stop loss (tsl) based on whether the direction is bullish or bearish.
Generates buy signals (Buy) when the close crosses above the trailing stop loss (tsl), and sell signals (Sell) when the close crosses below.
Alerts:
Purpose: Alerts are generated when buy or sell signals occur.
Implementation:
Uses alertcondition function to trigger alerts when Buy or Sell conditions are met.
Optional: Remove labels on weekends
Purpose: Prevents labels from appearing on weekends or non-trading days.
Implementation: Checks if the current day (dayOfWeek) is Saturday or Sunday, and deletes the labels (mondayLabel, tuesdayLabel, etc.) if true.
Summary:
This indicator provides visual and alert-based indications of buy and sell signals based on swing highs and lows, alongside labeling each trading day of the week in a distinctive manner. It's designed to assist traders in identifying potential entry and exit points based on these technical signals. Adjustments can be made to parameters such as the swing number (no) and color schemes to fit specific trading strategies or preferences.
受保護腳本
此腳本以閉源形式發佈。 不過,您可以自由使用,沒有任何限制 — 點擊此處了解更多。
免責聲明
這些資訊和出版物並非旨在提供,也不構成TradingView提供或認可的任何形式的財務、投資、交易或其他類型的建議或推薦。請閱讀使用條款以了解更多資訊。
受保護腳本
此腳本以閉源形式發佈。 不過,您可以自由使用,沒有任何限制 — 點擊此處了解更多。
免責聲明
這些資訊和出版物並非旨在提供,也不構成TradingView提供或認可的任何形式的財務、投資、交易或其他類型的建議或推薦。請閱讀使用條款以了解更多資訊。