OPEN-SOURCE SCRIPT
Daily Delta Trend
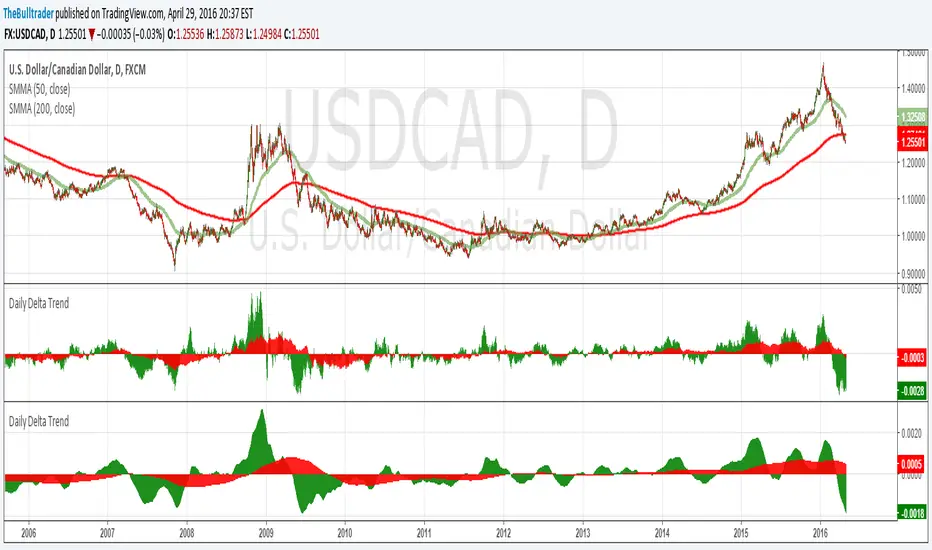
Daily Delta Trend is a useful exponential moving average of the 50 day and 200 day simple moving average. In the first Daily Delta Trend I realized that the simple moving averages were pretty choppy as they were buy then sell over short period of times. So I thought taking an average of another average would smooth my results and give it buy and sell signals more clearly. In chart 1, you can see that it is choppy, and in chart 2 is much smoother.
The way I've been interpreting the chart is to trade it only when the 50-day average (GREEN) Trades with 200-day average (RED). For example, when red and green are both >0 = Buy and both <0 = Sell.
Just from a little of pretesting, I was able to find solid trades from multiple pairs.
DISCLAIMER, I have not actually traded this indicator as I just wrote it for the past few hours, But I thought it was interesting and maybe I might trade it. Feel free to play with it and comment back :P
開源腳本
秉持TradingView一貫精神,這個腳本的創作者將其設為開源,以便交易者檢視並驗證其功能。向作者致敬!您可以免費使用此腳本,但請注意,重新發佈代碼需遵守我們的社群規範。
免責聲明
這些資訊和出版物並非旨在提供,也不構成TradingView提供或認可的任何形式的財務、投資、交易或其他類型的建議或推薦。請閱讀使用條款以了解更多資訊。
開源腳本
秉持TradingView一貫精神,這個腳本的創作者將其設為開源,以便交易者檢視並驗證其功能。向作者致敬!您可以免費使用此腳本,但請注意,重新發佈代碼需遵守我們的社群規範。
免責聲明
這些資訊和出版物並非旨在提供,也不構成TradingView提供或認可的任何形式的財務、投資、交易或其他類型的建議或推薦。請閱讀使用條款以了解更多資訊。