OPEN-SOURCE SCRIPT
Light LSMA
Estimating the LSMA Without Classics Parameters
I already mentioned various methods in order to estimate the LSMA in the idea i published. The parameter who still appeared on both the previous estimation and the classic LSMA was the sample correlation coefficient. This indicator will use an estimate of the correlation coefficient using the standard score thus providing a totally different approach in the estimation of the LSMA. My motivation for such indicator was to provide a different way to estimate a LSMA.
Standardization
The standard score is a statistical tool used to measure at how many standard deviations o a data point is bellow or above its mean. It can also be used to rescale variables, this conversion process is called standardizing or normalizing and it will be the basis of our estimation.
Calculation : (x - x̄)/o where x̄ is the moving average of x and o the standard deviation.
Estimating the Correlation Coefficient
We will use standardization to estimate the correlation coefficient r. 1 > r > -1 so in (y - x̄)/o we want to find y such that y is always above or below 1 standard deviation of x̄, i had for first idea to pass the price through a band-stop filter but i found it was better to just use a moving average of period/2.
Estimating the LSMA
We finally rescale a line through the price like mentioned in my previous idea, for that we standardize a line and we multiply the result by our correlation estimation, next we multiply the previous calculation by the price standard deviation, then we sum this calculation to the price moving average.
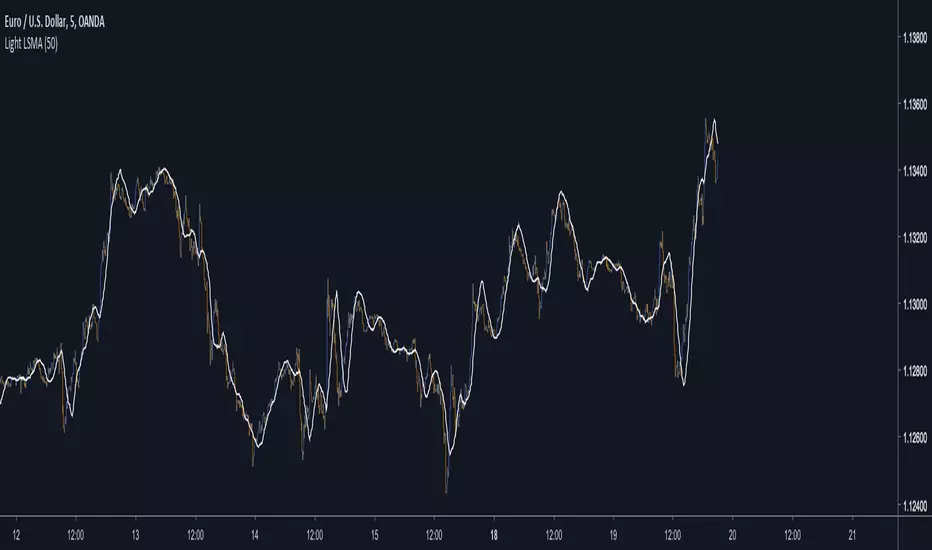
Comparison of our estimate in white with a LSMA in red with both period 50 :

Working With Different Independents Variables
Here the independent variable is a line n (which represent the number of data point and thus create a straight line) but a classic LSMA can work with other independent variables, for exemple if a LSMA use the volume as independent variable we need to change our correlation estimate with (ȳ - x̄)/ô where ȳ is the moving average of period length/2 of y, y is equal to : change(close,length)*change(volume,length) , x̄ is the moving average of y of period length, and ô is the standard deviation of y. This is quite rudimentary and if our goal is to provide a easier way to calculate correlation then the product-moment correlation coefficient would be more adapted (but less reactive than the sample correlation).
Conclusion
I showed a way to estimate the correlation coefficient, of course some tweaking could provide a better estimate but i find the result still quite close to the LSMA.
I already mentioned various methods in order to estimate the LSMA in the idea i published. The parameter who still appeared on both the previous estimation and the classic LSMA was the sample correlation coefficient. This indicator will use an estimate of the correlation coefficient using the standard score thus providing a totally different approach in the estimation of the LSMA. My motivation for such indicator was to provide a different way to estimate a LSMA.
Standardization
The standard score is a statistical tool used to measure at how many standard deviations o a data point is bellow or above its mean. It can also be used to rescale variables, this conversion process is called standardizing or normalizing and it will be the basis of our estimation.
Calculation : (x - x̄)/o where x̄ is the moving average of x and o the standard deviation.
Estimating the Correlation Coefficient
We will use standardization to estimate the correlation coefficient r. 1 > r > -1 so in (y - x̄)/o we want to find y such that y is always above or below 1 standard deviation of x̄, i had for first idea to pass the price through a band-stop filter but i found it was better to just use a moving average of period/2.
Estimating the LSMA
We finally rescale a line through the price like mentioned in my previous idea, for that we standardize a line and we multiply the result by our correlation estimation, next we multiply the previous calculation by the price standard deviation, then we sum this calculation to the price moving average.
Comparison of our estimate in white with a LSMA in red with both period 50 :
Working With Different Independents Variables
Here the independent variable is a line n (which represent the number of data point and thus create a straight line) but a classic LSMA can work with other independent variables, for exemple if a LSMA use the volume as independent variable we need to change our correlation estimate with (ȳ - x̄)/ô where ȳ is the moving average of period length/2 of y, y is equal to : change(close,length)*change(volume,length) , x̄ is the moving average of y of period length, and ô is the standard deviation of y. This is quite rudimentary and if our goal is to provide a easier way to calculate correlation then the product-moment correlation coefficient would be more adapted (but less reactive than the sample correlation).
Conclusion
I showed a way to estimate the correlation coefficient, of course some tweaking could provide a better estimate but i find the result still quite close to the LSMA.
開源腳本
秉持TradingView一貫精神,這個腳本的創作者將其設為開源,以便交易者檢視並驗證其功能。向作者致敬!您可以免費使用此腳本,但請注意,重新發佈代碼需遵守我們的社群規範。
Check out the indicators we are making at luxalgo: tradingview.com/u/LuxAlgo/
"My heart is so loud that I can't hear the fireworks"
"My heart is so loud that I can't hear the fireworks"
免責聲明
這些資訊和出版物並非旨在提供,也不構成TradingView提供或認可的任何形式的財務、投資、交易或其他類型的建議或推薦。請閱讀使用條款以了解更多資訊。