OPEN-SOURCE SCRIPT
PV's Dual RSI Crossover Strategy
Introduction to the Dual RSI Two-Cross Indicator
The Relative Strength Index (RSI) is a widely used technical indicator in finance that measures the magnitude of recent price changes to determine overbought or oversold conditions. The RSI Two-Cross indicator takes this concept a step further by introducing a unique twist: it plots two RSI lines with different lengths and generates alerts based on their crossovers.
Key Features:
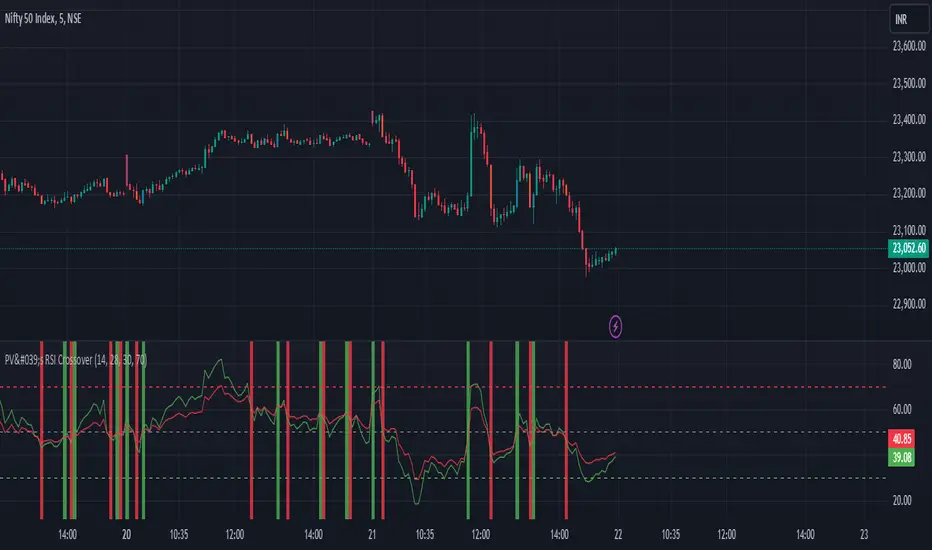
Dual RSI Lines: The indicator plots two RSI lines with user-defined lengths, allowing traders to compare the short-term and long-term momentum of an asset.
Crossover Alerts: The indicator generates alerts when the shorter RSI line crosses above or below the longer RSI line, indicating potential trend reversals or continuations.
Customizable Parameters: Users can adjust the lengths of the RSI lines, oversold and overbought levels, and other parameters to suit their trading strategy and asset of choice.
Visual Aids: The indicator features colored bars and backgrounds to highlight crossover events, making it easy to identify trading opportunities at a glance.
Trading Applications:
Trend Reversal Detection: The RSI Two-Cross indicator can help traders identify potential trend reversals by monitoring crossovers between the two RSI lines.
Momentum Confirmation: The indicator can be used to confirm momentum shifts in an asset's price, helping traders to filter out false signals and make more informed trading decisions.
Scalping and Day Trading: The indicator's short-term focus makes it suitable for scalping and day trading strategies, where traders aim to capitalize on small price movements.
By combining the versatility of the RSI with the power of crossover analysis, the RSI Two-Cross indicator offers a unique perspective on market momentum and trend dynamics. Whether you're a seasoned trader or just starting out, this indicator can help you navigate the markets with greater confidence and precision.
The Relative Strength Index (RSI) is a widely used technical indicator in finance that measures the magnitude of recent price changes to determine overbought or oversold conditions. The RSI Two-Cross indicator takes this concept a step further by introducing a unique twist: it plots two RSI lines with different lengths and generates alerts based on their crossovers.
Key Features:
Dual RSI Lines: The indicator plots two RSI lines with user-defined lengths, allowing traders to compare the short-term and long-term momentum of an asset.
Crossover Alerts: The indicator generates alerts when the shorter RSI line crosses above or below the longer RSI line, indicating potential trend reversals or continuations.
Customizable Parameters: Users can adjust the lengths of the RSI lines, oversold and overbought levels, and other parameters to suit their trading strategy and asset of choice.
Visual Aids: The indicator features colored bars and backgrounds to highlight crossover events, making it easy to identify trading opportunities at a glance.
Trading Applications:
Trend Reversal Detection: The RSI Two-Cross indicator can help traders identify potential trend reversals by monitoring crossovers between the two RSI lines.
Momentum Confirmation: The indicator can be used to confirm momentum shifts in an asset's price, helping traders to filter out false signals and make more informed trading decisions.
Scalping and Day Trading: The indicator's short-term focus makes it suitable for scalping and day trading strategies, where traders aim to capitalize on small price movements.
By combining the versatility of the RSI with the power of crossover analysis, the RSI Two-Cross indicator offers a unique perspective on market momentum and trend dynamics. Whether you're a seasoned trader or just starting out, this indicator can help you navigate the markets with greater confidence and precision.
開源腳本
秉持TradingView一貫精神,這個腳本的創作者將其設為開源,以便交易者檢視並驗證其功能。向作者致敬!您可以免費使用此腳本,但請注意,重新發佈代碼需遵守我們的社群規範。
免責聲明
這些資訊和出版物並非旨在提供,也不構成TradingView提供或認可的任何形式的財務、投資、交易或其他類型的建議或推薦。請閱讀使用條款以了解更多資訊。
免責聲明
這些資訊和出版物並非旨在提供,也不構成TradingView提供或認可的任何形式的財務、投資、交易或其他類型的建議或推薦。請閱讀使用條款以了解更多資訊。