OPEN-SOURCE SCRIPT
Didi Index
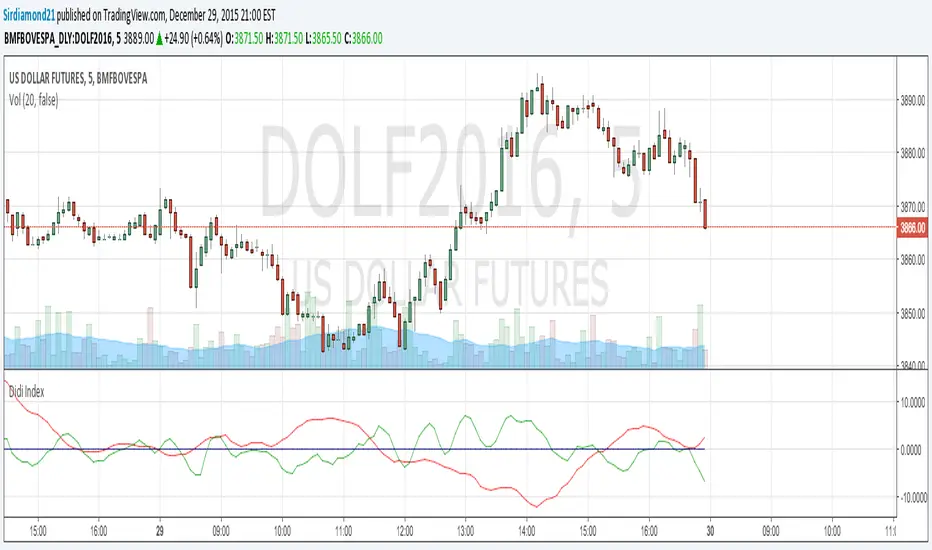
Indicator developed by Brazilian and analyst Odir Aguiar (Didi), consists of "Moving Averages", known for the famous needles Didi, which allows the visualization of reversal points.
The concept is very simple, when you insert 3 Moving Averages on display, one of three periods, an 8 and the other 20, there appears the formation of the indicator which works on an axis or center line 0. The needles occur when the intersection of averages comes closest to the line 0.
The concept is very simple, when you insert 3 Moving Averages on display, one of three periods, an 8 and the other 20, there appears the formation of the indicator which works on an axis or center line 0. The needles occur when the intersection of averages comes closest to the line 0.
開源腳本
秉持TradingView一貫精神,這個腳本的創作者將其設為開源,以便交易者檢視並驗證其功能。向作者致敬!您可以免費使用此腳本,但請注意,重新發佈代碼需遵守我們的社群規範。
免責聲明
這些資訊和出版物並非旨在提供,也不構成TradingView提供或認可的任何形式的財務、投資、交易或其他類型的建議或推薦。請閱讀使用條款以了解更多資訊。
開源腳本
秉持TradingView一貫精神,這個腳本的創作者將其設為開源,以便交易者檢視並驗證其功能。向作者致敬!您可以免費使用此腳本,但請注意,重新發佈代碼需遵守我們的社群規範。
免責聲明
這些資訊和出版物並非旨在提供,也不構成TradingView提供或認可的任何形式的財務、投資、交易或其他類型的建議或推薦。請閱讀使用條款以了解更多資訊。