INVITE-ONLY SCRIPT
shock detecter [WS]
It is paid version.
if you want free version

usually volaility and volume come together,
but if volume is high and volatility is low,
than blue bar increase.
I named it "abnormal volume shock"
so,
blue signal come only if low volatility + high volume.
blue can come when the price is top(or bottom) but this is not a buy(or sell) signal.
(remember, blue is just a strange moment. high volume + low volatility is not a normal situation. you better to focus "why suddenly volume increased" )
briefly,
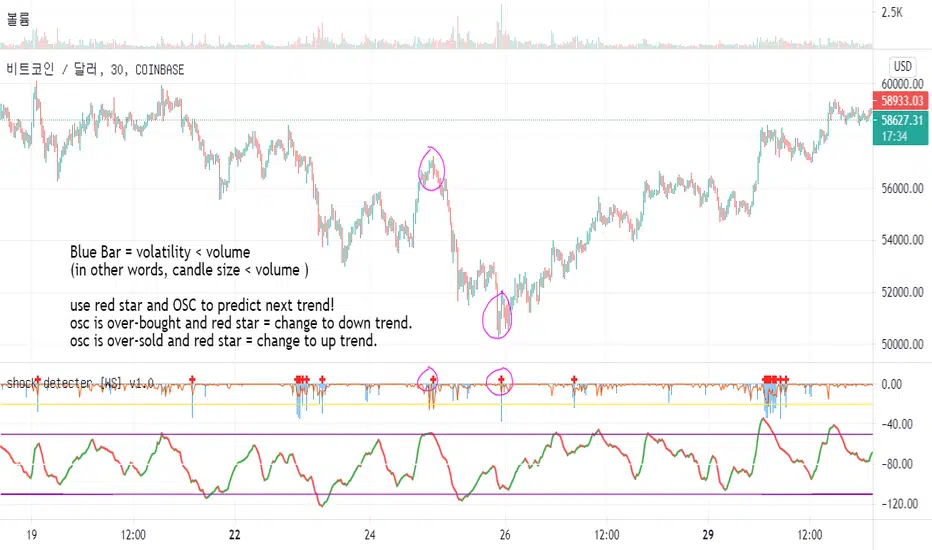
Blue Bar = volatility < volume
(in other words, candle size < volume )
use red star and OSC to predict next trend!
osc is over-bought and red star = change to down trend.
osc is over-sold and red star = change to up trend.
if simple_mode off,
green star = volume shock
orange star = volume shock over threshold (20)
green bar = volatility shock
yellow star = volatility shock over threshold (20)
red bar = volatility reducing (convergence)
white star = end of convergence
if you want free version
usually volaility and volume come together,
but if volume is high and volatility is low,
than blue bar increase.
I named it "abnormal volume shock"
so,
blue signal come only if low volatility + high volume.
blue can come when the price is top(or bottom) but this is not a buy(or sell) signal.
(remember, blue is just a strange moment. high volume + low volatility is not a normal situation. you better to focus "why suddenly volume increased" )
briefly,
Blue Bar = volatility < volume
(in other words, candle size < volume )
use red star and OSC to predict next trend!
osc is over-bought and red star = change to down trend.
osc is over-sold and red star = change to up trend.
if simple_mode off,
green star = volume shock
orange star = volume shock over threshold (20)
green bar = volatility shock
yellow star = volatility shock over threshold (20)
red bar = volatility reducing (convergence)
white star = end of convergence
免責聲明
這些資訊和出版物並非旨在提供,也不構成TradingView提供或認可的任何形式的財務、投資、交易或其他類型的建議或推薦。請閱讀使用條款以了解更多資訊。