INVITE-ONLY SCRIPT
Merek Equal Highs and Lows
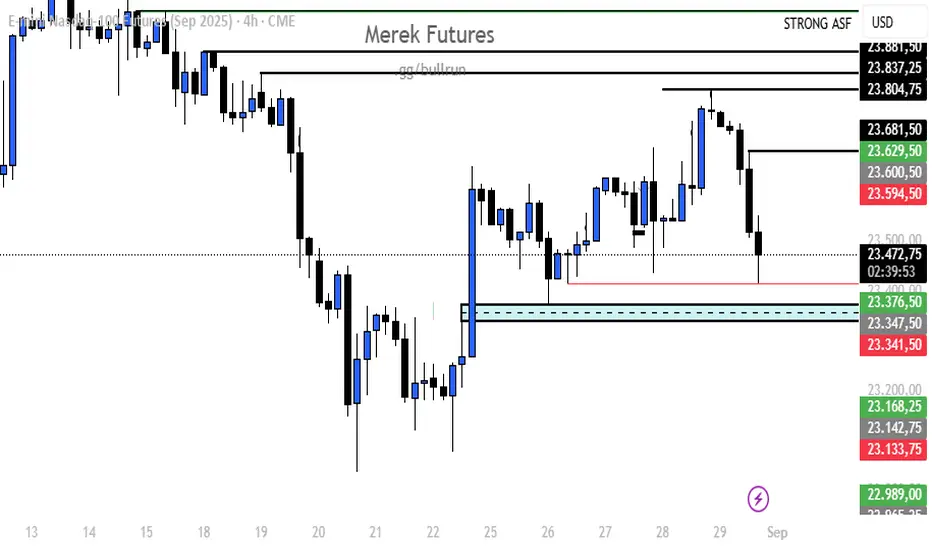
EQH – Equal Highs Indicator
Description:
The EQH indicator detects Equal Highs on the chart. This occurs when price reaches the same high level two or more times without breaking it decisively.
Interpretation:
Liquidity zone: Equal highs are often seen as areas where liquidity (stop-loss clusters) is located.
Breakout potential: A break above this level often signals that liquidity is being taken before either a reversal or continuation of the trend.
Market structure: EQH highlights resistance areas that can serve as key decision points for traders.
Use cases:
Identifying potential stop-hunt zones
Spotting resistance levels
Anticipating liquidity grabs before reversals or trend continuations
EQL – Equal Lows Indicator
Description:
The EQL indicator detects Equal Lows on the chart. This occurs when price reaches the same low level two or more times without breaking lower.
Interpretation:
Liquidity zone: Equal lows are areas where liquidity (sell-side stops) tends to accumulate.
Breakout potential: A move below this level often indicates liquidity being swept before a possible reversal or continuation.
Market structure: EQL highlights support areas that can be critical for trade decisions.
Use cases:
Identifying sell-side liquidity zones
Spotting support levels
Recognizing possible stop-hunts before reversals or trend continuations
Description:
The EQH indicator detects Equal Highs on the chart. This occurs when price reaches the same high level two or more times without breaking it decisively.
Interpretation:
Liquidity zone: Equal highs are often seen as areas where liquidity (stop-loss clusters) is located.
Breakout potential: A break above this level often signals that liquidity is being taken before either a reversal or continuation of the trend.
Market structure: EQH highlights resistance areas that can serve as key decision points for traders.
Use cases:
Identifying potential stop-hunt zones
Spotting resistance levels
Anticipating liquidity grabs before reversals or trend continuations
EQL – Equal Lows Indicator
Description:
The EQL indicator detects Equal Lows on the chart. This occurs when price reaches the same low level two or more times without breaking lower.
Interpretation:
Liquidity zone: Equal lows are areas where liquidity (sell-side stops) tends to accumulate.
Breakout potential: A move below this level often indicates liquidity being swept before a possible reversal or continuation.
Market structure: EQL highlights support areas that can be critical for trade decisions.
Use cases:
Identifying sell-side liquidity zones
Spotting support levels
Recognizing possible stop-hunts before reversals or trend continuations
僅限邀請腳本
僅作者批准的使用者才能訪問此腳本。您需要申請並獲得使用許可,通常需在付款後才能取得。更多詳情,請依照作者以下的指示操作,或直接聯絡Merek_Real。
TradingView不建議在未完全信任作者並了解其運作方式的情況下購買或使用腳本。您也可以在我們的社群腳本中找到免費的開源替代方案。
作者的說明
EQL and EQH Indicator for free from merek
免責聲明
這些資訊和出版物並非旨在提供,也不構成TradingView提供或認可的任何形式的財務、投資、交易或其他類型的建議或推薦。請閱讀使用條款以了解更多資訊。
僅限邀請腳本
僅作者批准的使用者才能訪問此腳本。您需要申請並獲得使用許可,通常需在付款後才能取得。更多詳情,請依照作者以下的指示操作,或直接聯絡Merek_Real。
TradingView不建議在未完全信任作者並了解其運作方式的情況下購買或使用腳本。您也可以在我們的社群腳本中找到免費的開源替代方案。
作者的說明
EQL and EQH Indicator for free from merek
免責聲明
這些資訊和出版物並非旨在提供,也不構成TradingView提供或認可的任何形式的財務、投資、交易或其他類型的建議或推薦。請閱讀使用條款以了解更多資訊。