OPEN-SOURCE SCRIPT
Advanced HFT Detection with VWAP & Spreads
Explanation of the HFT Detection Strategy
🔹 1. Key Indicators Used in the Strategy
It's works by combining VWAP, moving averages (SMA), volume spikes, and price jumps to detect potential HFT activity.
✅ (A) VWAP (Volume Weighted Average Price)
VWAP acts as a benchmark price that professional traders and institutions use to execute large orders.
If price is above VWAP, buyers are in control → Bullish trend
If price is below VWAP, sellers are in control → Bearish trend
HFT algorithms often place buy orders above VWAP and sell orders below VWAP to follow momentum.
➡️ Why VWAP? It ensures that signals follow the institutional trading trend.
✅ (B) Moving Averages (SMA)
Moving averages smooth out price data and help in detecting short-term momentum changes.
Fast Moving Average (5-period SMA): Reacts quickly to price changes
Slow Moving Average (20-period SMA): Identifies trend direction
➡️ Why SMA? It filters noise and confirms short-term trend shifts.
✅ (C) Volume Spike Detection
High-frequency trading is often accompanied by large volume surges. We define a volume spike as:
📌 Current Volume > 2× Average Volume of last 20 bars
➡️ Why Volume? HFTs execute rapid buy/sell orders when they detect liquidity, leading to sudden volume bursts.
✅ (D) Price Jump Detection (Sudden Volatility)
HFT algorithms often exploit quick price movements. We check if the price has moved more than twice the ATR (Average True Range) in the last 5 bars.
➡️ Why ATR? It helps to detect abnormal price movements compared to normal volatility.
🔹 2. Trading Signal Logic
Now that we have VWAP, moving averages, volume, and price movement filters, we generate buy and sell signals based on conditions.
✅ (A) Buy Signal Condition
A BUY signal is triggered when:
✔ Fast SMA crosses above Slow SMA → Short-term trend is turning bullish
✔ Volume spike occurs → HFTs are active
✔ Sudden price jump detected → High volatility
✔ Price is above VWAP → Confirms bullish trend
➡️ Why this works? It confirms that institutional traders & HFTs are buying aggressively.
✅ (B) Sell Signal Condition
A SELL signal is triggered when:
✔ Fast SMA crosses below Slow SMA → Short-term trend is turning bearish
✔ Volume spike occurs → HFTs are selling aggressively
✔ Sudden price drop detected → High volatility
✔ Price is below VWAP → Confirms bearish trend
➡️ Why this works? It confirms that institutional traders & HFTs are selling aggressively.
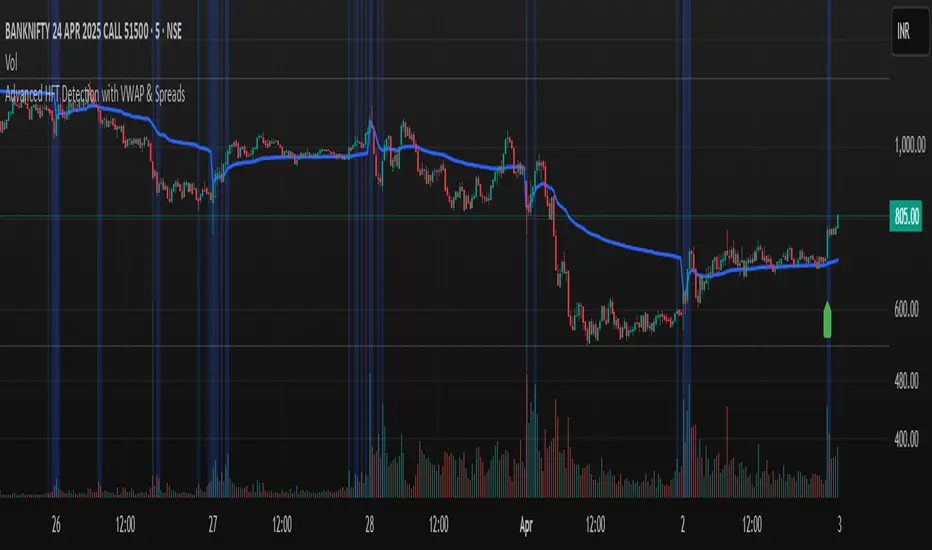
🔹 3. Visual Representation (Plotting Signals & VWAP)
Once we detect buy and sell signals, we mark them on the chart.
✅ (A) Buy/Sell Markers
🟢 Buy → Green upward arrow below the candle
🔴 Sell → Red downward arrow above the candle
✅ (B) VWAP Line on Chart
We also plot VWAP as a blue line to visualize trend direction.
✅ (C) Highlighting Volume Spikes
To easily spot HFT activity, we highlight volume spike bars with a blue background.
🔹 4. How to Use This Strategy?
1️⃣ Apply this script on a 1-minute or 5-minute intraday chart.
2️⃣ Look for BUY signals above VWAP and SELL signals below VWAP.
3️⃣ Verify that the volume spikes before taking action.
4️⃣ Use stop-loss & risk management (e.g., stop-loss at recent low/high).
🚀 Summary: Why This Strategy Works?
✅ VWAP ensures we follow institutional traders
✅ Volume spikes confirm sudden liquidity inflows
✅ Price jumps detect fast market moves caused by HFT bots
✅ Moving averages smooth out short-term trend shifts
🔹 1. Key Indicators Used in the Strategy
It's works by combining VWAP, moving averages (SMA), volume spikes, and price jumps to detect potential HFT activity.
✅ (A) VWAP (Volume Weighted Average Price)
VWAP acts as a benchmark price that professional traders and institutions use to execute large orders.
If price is above VWAP, buyers are in control → Bullish trend
If price is below VWAP, sellers are in control → Bearish trend
HFT algorithms often place buy orders above VWAP and sell orders below VWAP to follow momentum.
➡️ Why VWAP? It ensures that signals follow the institutional trading trend.
✅ (B) Moving Averages (SMA)
Moving averages smooth out price data and help in detecting short-term momentum changes.
Fast Moving Average (5-period SMA): Reacts quickly to price changes
Slow Moving Average (20-period SMA): Identifies trend direction
➡️ Why SMA? It filters noise and confirms short-term trend shifts.
✅ (C) Volume Spike Detection
High-frequency trading is often accompanied by large volume surges. We define a volume spike as:
📌 Current Volume > 2× Average Volume of last 20 bars
➡️ Why Volume? HFTs execute rapid buy/sell orders when they detect liquidity, leading to sudden volume bursts.
✅ (D) Price Jump Detection (Sudden Volatility)
HFT algorithms often exploit quick price movements. We check if the price has moved more than twice the ATR (Average True Range) in the last 5 bars.
➡️ Why ATR? It helps to detect abnormal price movements compared to normal volatility.
🔹 2. Trading Signal Logic
Now that we have VWAP, moving averages, volume, and price movement filters, we generate buy and sell signals based on conditions.
✅ (A) Buy Signal Condition
A BUY signal is triggered when:
✔ Fast SMA crosses above Slow SMA → Short-term trend is turning bullish
✔ Volume spike occurs → HFTs are active
✔ Sudden price jump detected → High volatility
✔ Price is above VWAP → Confirms bullish trend
➡️ Why this works? It confirms that institutional traders & HFTs are buying aggressively.
✅ (B) Sell Signal Condition
A SELL signal is triggered when:
✔ Fast SMA crosses below Slow SMA → Short-term trend is turning bearish
✔ Volume spike occurs → HFTs are selling aggressively
✔ Sudden price drop detected → High volatility
✔ Price is below VWAP → Confirms bearish trend
➡️ Why this works? It confirms that institutional traders & HFTs are selling aggressively.
🔹 3. Visual Representation (Plotting Signals & VWAP)
Once we detect buy and sell signals, we mark them on the chart.
✅ (A) Buy/Sell Markers
🟢 Buy → Green upward arrow below the candle
🔴 Sell → Red downward arrow above the candle
✅ (B) VWAP Line on Chart
We also plot VWAP as a blue line to visualize trend direction.
✅ (C) Highlighting Volume Spikes
To easily spot HFT activity, we highlight volume spike bars with a blue background.
🔹 4. How to Use This Strategy?
1️⃣ Apply this script on a 1-minute or 5-minute intraday chart.
2️⃣ Look for BUY signals above VWAP and SELL signals below VWAP.
3️⃣ Verify that the volume spikes before taking action.
4️⃣ Use stop-loss & risk management (e.g., stop-loss at recent low/high).
🚀 Summary: Why This Strategy Works?
✅ VWAP ensures we follow institutional traders
✅ Volume spikes confirm sudden liquidity inflows
✅ Price jumps detect fast market moves caused by HFT bots
✅ Moving averages smooth out short-term trend shifts
開源腳本
秉持TradingView一貫精神,這個腳本的創作者將其設為開源,以便交易者檢視並驗證其功能。向作者致敬!您可以免費使用此腳本,但請注意,重新發佈代碼需遵守我們的社群規範。
免責聲明
這些資訊和出版物並非旨在提供,也不構成TradingView提供或認可的任何形式的財務、投資、交易或其他類型的建議或推薦。請閱讀使用條款以了解更多資訊。
開源腳本
秉持TradingView一貫精神,這個腳本的創作者將其設為開源,以便交易者檢視並驗證其功能。向作者致敬!您可以免費使用此腳本,但請注意,重新發佈代碼需遵守我們的社群規範。
免責聲明
這些資訊和出版物並非旨在提供,也不構成TradingView提供或認可的任何形式的財務、投資、交易或其他類型的建議或推薦。請閱讀使用條款以了解更多資訊。