OPEN-SOURCE SCRIPT
✅ Multi-TF RSI Buy/Sell Signal + Debug Panel
Multi-TF RSI Buy/Sell Signal + Debug Panel
This script provides RSI-based Buy and Sell signals confirmed across multiple timeframes, designed to help identify high-confluence market entries. Includes an optional debug panel for real-time monitoring and diagnostics.
How It Works
RSI Thresholds:
Oversold (OS): RSI < Oversold value → potential Buy
Overbought (OB): RSI > Overbought value → potential Sell
Timeframe Inputs:
You can monitor RSI across up to 4 different timeframes (customizable).
You can enable/disable each individually.
Signal Confirmation:
You define how many of the selected timeframes need to agree (via Min Confirmations).
If Auto Confirm is enabled, it automatically matches the number of confirmations to how many timeframes are enabled.
Signal Logic:
If enough RSI values are oversold, a Buy arrow is shown below the bar.
If enough RSI values are overbought, a Sell arrow appears above the bar.
Alerts are also triggered accordingly.
How to Use
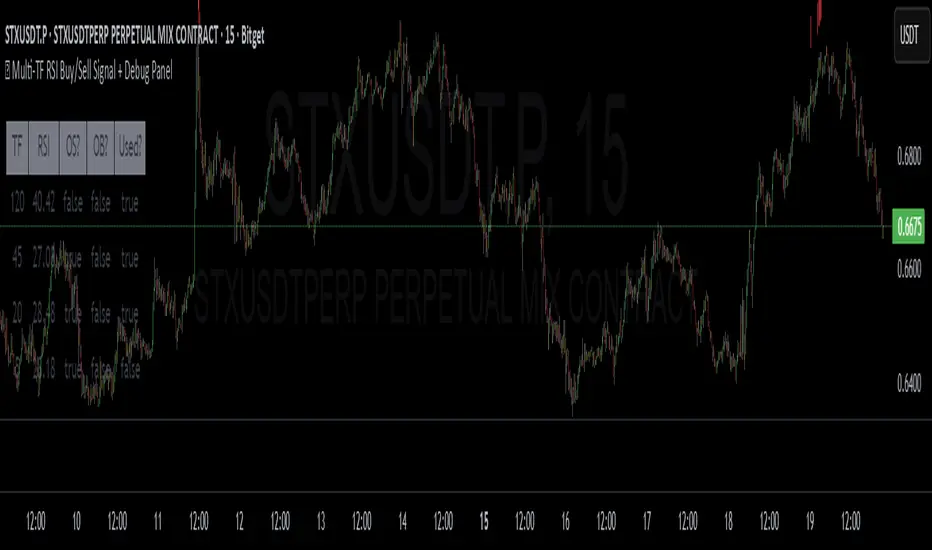
Debug Panel
Toggle it on/off via Show Debug Panel.
Move its position to any chart corner.
Updates every 5 bars.
Displays:
Each TF label
RSI value
If it's currently oversold/overbought
If that TF is currently enabled
Tips:
Try to match chart timeframe with one of your selected TFs for better signal visibility.
Use in confluence with other indicators for best results.
RSI alone is not a guaranteed signal – treat it as a filter or alert, not a full strategy.
Notes
This is not financial advice. Always combine with your own analysis.
RSI-based systems work best in ranging or balanced conditions.
Confirmation logic helps reduce noise, but no indicator is infallible.
開源腳本
秉持TradingView一貫精神,這個腳本的創作者將其設為開源,以便交易者檢視並驗證其功能。向作者致敬!您可以免費使用此腳本,但請注意,重新發佈代碼需遵守我們的社群規範。
免責聲明
這些資訊和出版物並非旨在提供,也不構成TradingView提供或認可的任何形式的財務、投資、交易或其他類型的建議或推薦。請閱讀使用條款以了解更多資訊。
免責聲明
這些資訊和出版物並非旨在提供,也不構成TradingView提供或認可的任何形式的財務、投資、交易或其他類型的建議或推薦。請閱讀使用條款以了解更多資訊。