OPEN-SOURCE SCRIPT
已更新 AlphaDragon: Data visualizer
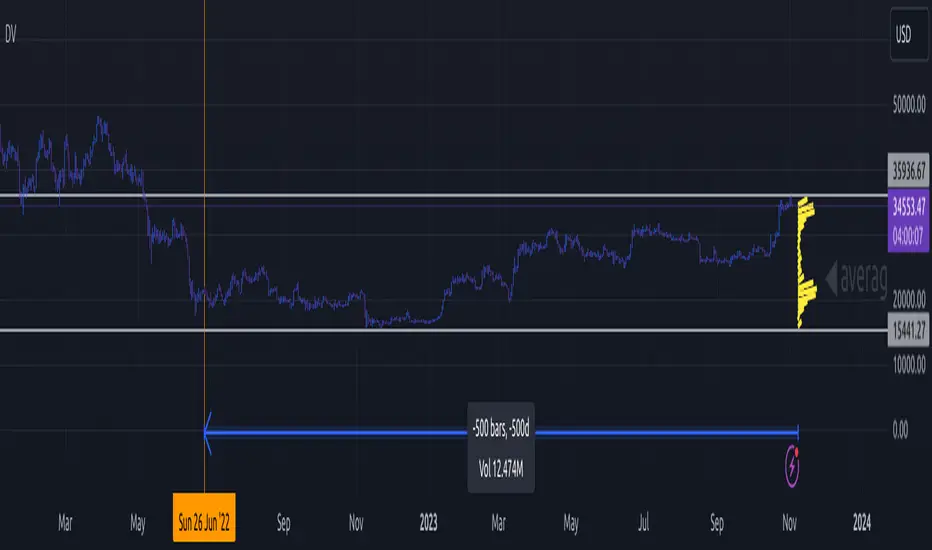
Aggregates source data into 2D vertical histogram.
Aggregates samples (lenght) in a window (from 0% to 100%). N samples are gathered in 1% brackets.
Visualizer gathers 5% of each window, and display width corresponding to amount of samples, in that bracket.
Aggregates samples (lenght) in a window (from 0% to 100%). N samples are gathered in 1% brackets.
Visualizer gathers 5% of each window, and display width corresponding to amount of samples, in that bracket.
發行說明
Added math.round - but it does not fix the graph draw發行說明
Updated histogramin next version:
- projected two types of histogram
- Better, its own X/Y chart (one type)
- Updated this 2D as an overlay
發行說明
updated chart開源腳本
秉持TradingView一貫精神,這個腳本的創作者將其設為開源,以便交易者檢視並驗證其功能。向作者致敬!您可以免費使用此腳本,但請注意,重新發佈代碼需遵守我們的社群規範。
免責聲明
這些資訊和出版物並非旨在提供,也不構成TradingView提供或認可的任何形式的財務、投資、交易或其他類型的建議或推薦。請閱讀使用條款以了解更多資訊。
開源腳本
秉持TradingView一貫精神,這個腳本的創作者將其設為開源,以便交易者檢視並驗證其功能。向作者致敬!您可以免費使用此腳本,但請注意,重新發佈代碼需遵守我們的社群規範。
免責聲明
這些資訊和出版物並非旨在提供,也不構成TradingView提供或認可的任何形式的財務、投資、交易或其他類型的建議或推薦。請閱讀使用條款以了解更多資訊。