INVITE-ONLY SCRIPT
TradeMate - Trend Tamer
TradeMate Trend Tamer
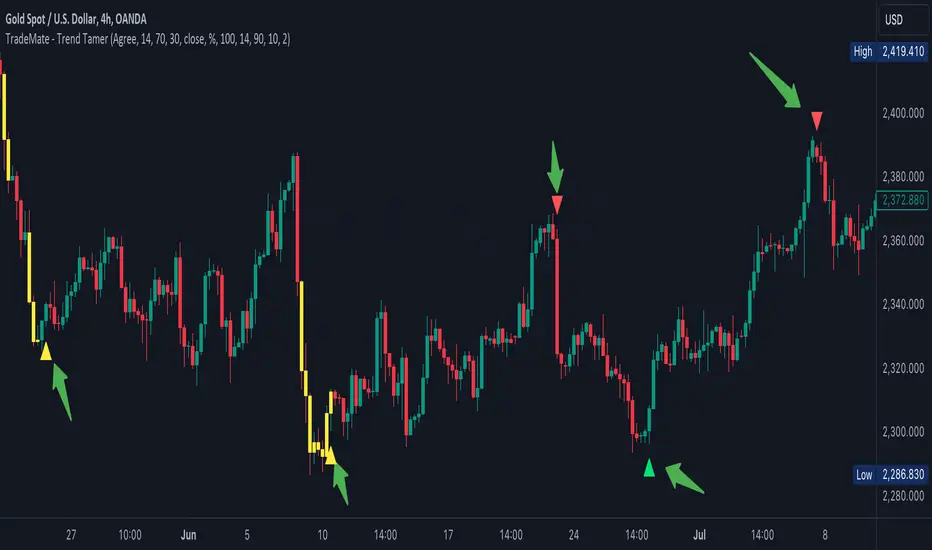
The TradeMate Trend Tamer is designed to help traders identify potential trend reversals and navigate periods of high market volatility. This tool combines a custom EMA-based oscillator with a volatility detection mechanism, providing traders with actionable signals that are easy to interpret and apply.
🔶 Originality and Utility
The TradeMate Trend Tamer is not just a mashup of indicators but a well-integrated system that enhances the reliability of trend detection. The core of this indicator is a custom EMA calculation that identifies trend shifts based on price momentum and directional changes. This EMA is further enhanced by a volatility detection system that colors bars yellow during periods of high volatility, indicating potential market reversals.
The indicator is particularly useful for traders who are looking for clear and straightforward signals to identify buying and selling opportunities, especially in volatile markets where traditional indicators might produce false signals. By combining trend arrows with volatility signals, the TradeMate Trend Tamer helps traders confirm the strength of a signal and avoid getting caught in market noise.
🔶 Description and Underlying Logic
The TradeMate Trend Tamer uses a custom EMA calculation that smooths price movements to detect significant shifts in momentum. This EMA is plotted on the chart and is complemented by arrows indicating potential buy or sell signals:
Upward Arrows: These appear when the EMA indicates an upward momentum shift, suggesting a potential buying opportunity.
Downward Arrows: These indicate a downward momentum shift, signaling a potential selling opportunity.
The volatility detection mechanism works by analyzing the ATR (Average True Range) over a specified lookback period. The indicator identifies extreme volatility zones where the ATR exceeds a certain threshold, coloring the bars yellow to visually alert traders. This helps traders identify when the market is more likely to reverse, making the combination of trend arrows and volatility signals a powerful tool for decision-making.
🔶 Using the TradeMate Trend Tamer
Traders should use the trend arrows as an initial signal and confirm it with the yellow-colored volatility bars. For example:
High Volatility with Upward Arrow: Indicates a strong buy signal as the market is likely to reverse upwards.
High Volatility with Downward Arrow: Indicates a strong sell signal, suggesting a potential downward reversal.
By following these signals, traders can enhance their entry and exit strategies, especially in markets prone to sudden moves.
僅限邀請腳本
僅作者批准的使用者才能訪問此腳本。您需要申請並獲得使用許可,通常需在付款後才能取得。更多詳情,請依照作者以下的指示操作,或直接聯絡Morpheus_Trading_Suite。
TradingView不建議在未完全信任作者並了解其運作方式的情況下購買或使用腳本。您也可以在我們的社群腳本中找到免費的開源替代方案。
作者的說明
For traders interested in accessing the TradeMate Trend Tamer, please follow the author’s instructions below: - Contact the author privately or follow the provided link to request access. - Or at http://www.trademate.gg
免責聲明
這些資訊和出版物並非旨在提供,也不構成TradingView提供或認可的任何形式的財務、投資、交易或其他類型的建議或推薦。請閱讀使用條款以了解更多資訊。