INVITE-ONLY SCRIPT
已更新 Relative Breadth Index
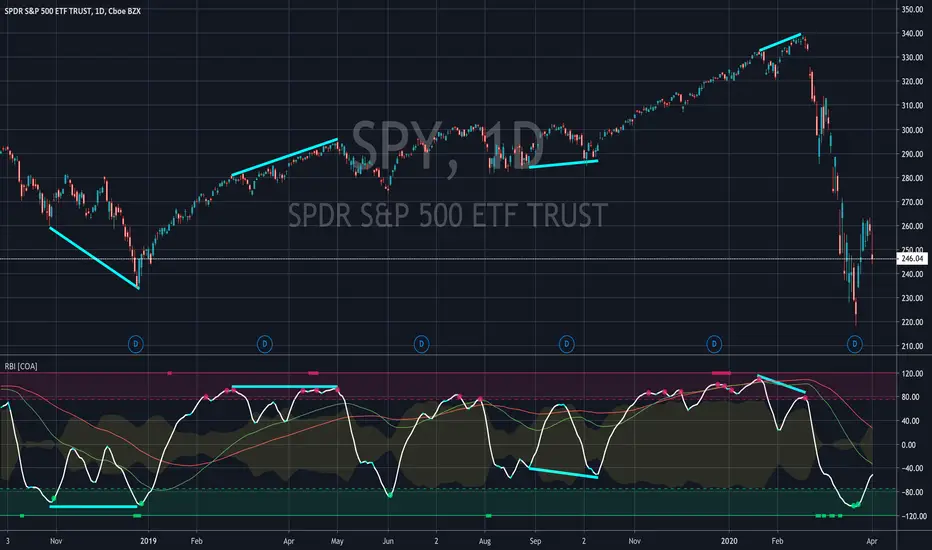
RBI is an intricate oscillator that calculates relative breadth of an asset according to its trend. If you want to detect reversals, continuations, trend strength, divergences, and confirm other signals, read on.
Relative Breadth Index has 4 main components:
How does it work?
What are the signals?
What about the Pulse?
For access, please DM us or visit the link below in our Signature.
Relative Breadth Index has 4 main components:
- Fast (White), Medium (Green), and Slow (Red) Oscillators
- Overbought and Oversold Thresholds (Shaded Areas)
- Pulse (Yellow)
- Divergence Indicator (Rectangles)
How does it work?
- The Medium and Slow Oscillators indicate the general trend.
- The Fast Oscillator shows what price action is doing in reference to that trend.
- Pulse suggests the probability that the current move (Fast) is an end of the trend defined by the Medium and Slow lines.
- The Divergence Indicator also suggests a reversal and to look for divergences between the Fast line and price action.
What are the signals?
- In general: green signals are bullish, red are bullish
- Rectangles: Look for a divergence
- Circles: Sell and buy signals
- Triangles: Stronger sell and buy signals
- Triangles: Reversal signal
What about the Pulse?
- If Pulse is low, a signal may only be a short-lived move.
- If Pulse is high, a signal may be a full-on trend reversal.
For access, please DM us or visit the link below in our Signature.
發行說明
You can now set alerts off RBI signals.僅限邀請腳本
僅作者批准的使用者才能訪問此腳本。您需要申請並獲得使用許可,通常需在付款後才能取得。更多詳情,請依照作者以下的指示操作,或直接聯絡CoinObservatory。
TradingView不建議在未完全信任作者並了解其運作方式的情況下購買或使用腳本。您也可以在我們的社群腳本中找到免費的開源替代方案。
作者的說明
Thanks for checking us out!
For access to our TradingView scripts, visit us at
linktr.ee/coinobs
For access to our TradingView scripts, visit us at
linktr.ee/coinobs
免責聲明
這些資訊和出版物並非旨在提供,也不構成TradingView提供或認可的任何形式的財務、投資、交易或其他類型的建議或推薦。請閱讀使用條款以了解更多資訊。
僅限邀請腳本
僅作者批准的使用者才能訪問此腳本。您需要申請並獲得使用許可,通常需在付款後才能取得。更多詳情,請依照作者以下的指示操作,或直接聯絡CoinObservatory。
TradingView不建議在未完全信任作者並了解其運作方式的情況下購買或使用腳本。您也可以在我們的社群腳本中找到免費的開源替代方案。
作者的說明
Thanks for checking us out!
For access to our TradingView scripts, visit us at
linktr.ee/coinobs
For access to our TradingView scripts, visit us at
linktr.ee/coinobs
免責聲明
這些資訊和出版物並非旨在提供,也不構成TradingView提供或認可的任何形式的財務、投資、交易或其他類型的建議或推薦。請閱讀使用條款以了解更多資訊。