OPEN-SOURCE SCRIPT
已更新 Reverse MACD Indicator
Introducing the reverse MACD Indicator.
This is my Pinescript implementation of the reverse MACD indicator.
Much respect to Mr Johnny Dough the original creator of this idea.
Feel free to reuse this script, drop me a note below if you find this useful.
Investopedia defines the MACD as a trend-following momentum indicator that shows the relationship between two moving averages of a security’s price.
The MACD is calculated by subtracting the 26-period Exponential Moving Average ( EMA ) from the 12-period EMA .
The result of that calculation is the MACD line.
A nine-day EMA of the MACD called the "signal line," is then plotted on top of the MACD line, which can function as a trigger for buy and sell signals.
Traders may buy the security when the MACD crosses above its signal line and sell—or short—the security when the MACD crosses below the signal line.
Moving Average Convergence Divergence ( MACD ) indicators can be interpreted in several ways, but the more common methods are crossovers, divergences, and rapid rises/falls.
MACD triggers technical signals when it crosses above (to buy) or below (to sell) its signal line.
The speed of crossovers is also taken as a signal of a market is overbought or oversold.
MACD helps investors understand whether the bullish or bearish movement in the price is strengthening or weakening.
The MACD has a positive value (shown as the red line on the price chart ) whenever the 12-period EMA ( indicated by the blue line on the price chart) is above the 26-period EMA (the red line in the price chart) and a negative value when the 12-period EMA is below the 26-period EMA .
The more distant the MACD is above or below its baseline indicates that the distance between the two EMAs is growing.
The baseline here is the white line.
The Reverse function of the MACD provides value by letting the user know the specific price needed to expect a MACD cross over in the opposite direction.
This function can be used to designate risk parameters for a potential trade if using the MACD as their source of edge, letting the user know exactly where and how much their risk is for a potential trade which can be used to design an effective trading plan.
發行說明
By request I have..Broken the code down into separated functions, and added clear descriptions of function operation.
Altered some variable naming for easier reading.
發行說明
Forgot to actually implement one of the newly declared functions.. lol .. done now.發行說明
Added optional RMACD derived Bollinger Bands by request.發行說明
Further expanded the description of the functions for clarity.發行說明
Corrected function Price and Length variable naming.發行說明
Another little tidy up發行說明
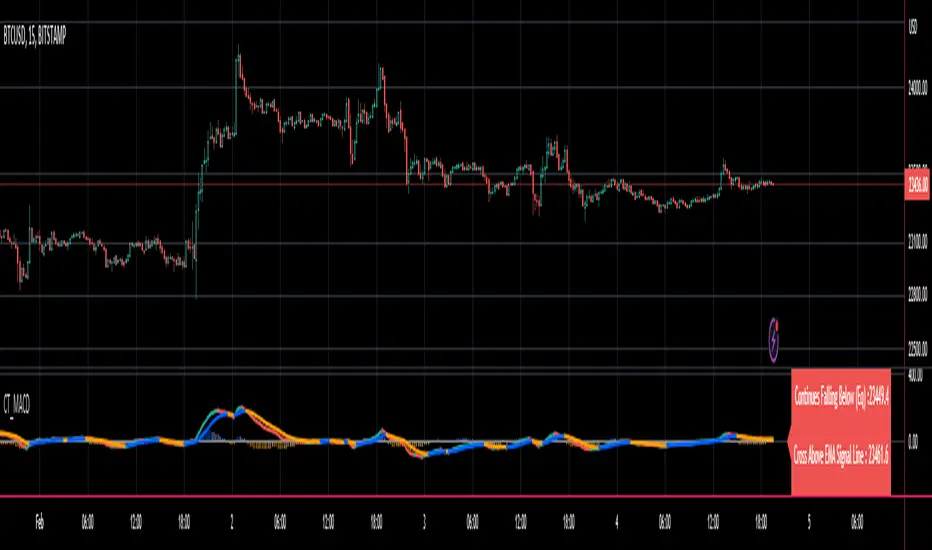
I have brought the original idea to its logical conclusion for the MACD by creating a new function which also computes the price level required to cross the MACD with its signal line.This allows the user to quickly see all of the most relevant information from the MACD and the actual price levels where the indicator will change its posture.
For the sake of clarity I have changed the EQ level to an orange plot
The signal line crossover level plots blue when the macd is above the signal line and red below it.
The zero line is white as usual
I have added an infobox which will show
- Whether the MACD is falling or rising
- the price level which will make the MACD to change from rising to falling or vice versa
- the price level which will cause the MACD to cross the signal line
- the price level which will cause the MACD to cross the zero line
發行說明
Created and added SMA signal line cross function by request..Added
- optional SMA signal line
Modified textbox info and coloring logic for clarity
發行說明
minor color change發行說明
Altered input variables naming for clarity發行說明
Upgraded to Pinescript version 5Added plot & color options.
Added settings headings.
開源腳本
秉持TradingView一貫精神,這個腳本的創作者將其設為開源,以便交易者檢視並驗證其功能。向作者致敬!您可以免費使用此腳本,但請注意,重新發佈代碼需遵守我們的社群規範。
You may contact me on Krown's Crypto Cave Discord: discord.gg/W9ettX54DF My Discord username is The Caretaker.
My Private indicators are available via :
krown-trading.teachable.com/?affcode=236462_mm1lb1_w
My Private indicators are available via :
krown-trading.teachable.com/?affcode=236462_mm1lb1_w
免責聲明
這些資訊和出版物並非旨在提供,也不構成TradingView提供或認可的任何形式的財務、投資、交易或其他類型的建議或推薦。請閱讀使用條款以了解更多資訊。