OPEN-SOURCE SCRIPT
conditional_returns
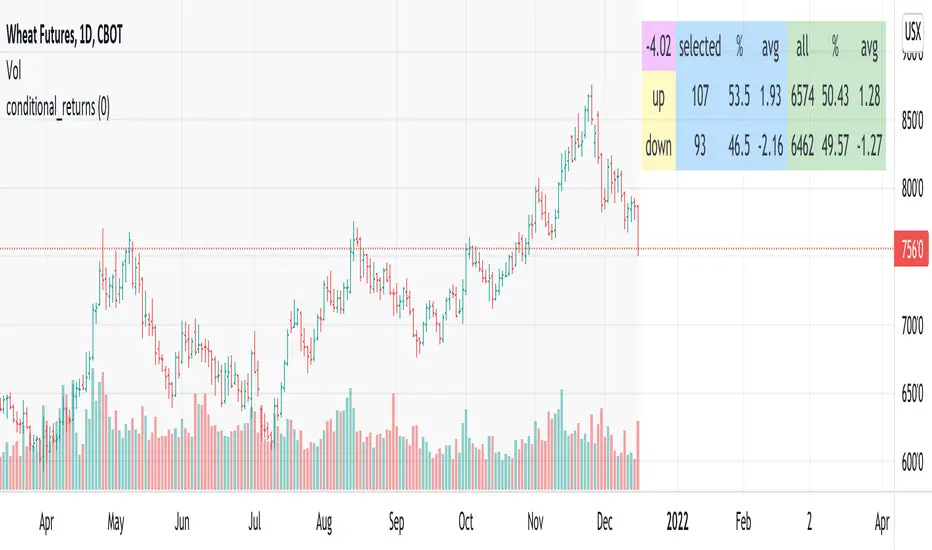
This script attempts to contextualize the instrument's latest return. It asks, "when a return of the same or greater magnitude occurred in the past, in the same direction, what was the following period's return?"
By default, the latest return is used. For example, on a daily chart, that would mean "today's" return. However, you can select any return you want using the "override" input.
The output table shows:
- The latest/override return, as a percentage. This is in the top left, fuchsia cell.
The first three, blue columns, show:
- The count of up and down (or positive and negative) next period returns. This shows you the sample size.
- The percentage of up/down next period returns.
- The average next-period return return, up and down, as percentages.
The next three, green columns show these same statistics, but for all returns--every period in the active date range is used. This data serves as a basis for comparison.
Note that you can select a custom date range with the "start" and "end" inputs. The corresponding area on the chart is shaded light grey, to show which data is used in the computations.
開源腳本
秉持TradingView一貫精神,這個腳本的創作者將其設為開源,以便交易者檢視並驗證其功能。向作者致敬!您可以免費使用此腳本,但請注意,重新發佈代碼需遵守我們的社群規範。
免責聲明
這些資訊和出版物並非旨在提供,也不構成TradingView提供或認可的任何形式的財務、投資、交易或其他類型的建議或推薦。請閱讀使用條款以了解更多資訊。
免責聲明
這些資訊和出版物並非旨在提供,也不構成TradingView提供或認可的任何形式的財務、投資、交易或其他類型的建議或推薦。請閱讀使用條款以了解更多資訊。