OPEN-SOURCE SCRIPT
111D SMA / (350D SMA * 2)
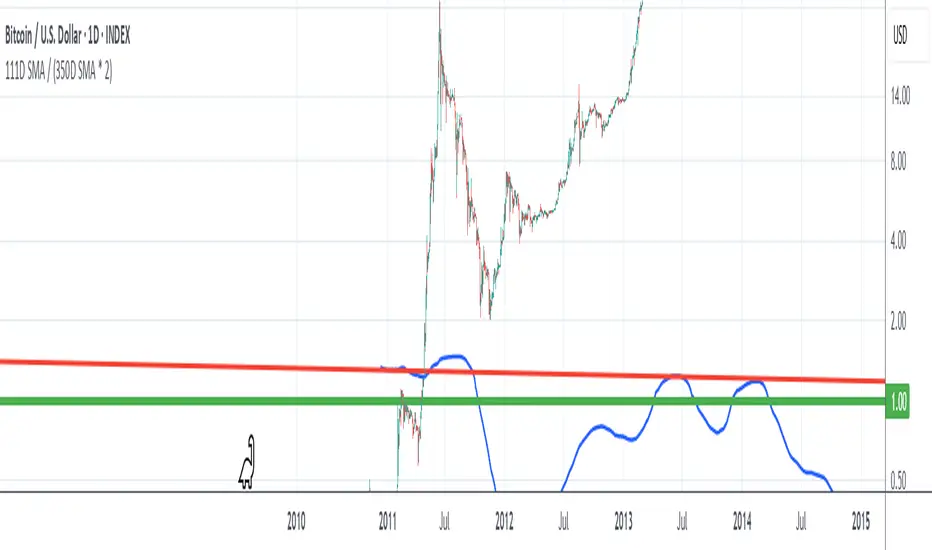
Indicator: Pi Cycle Ratio
This custom technical indicator calculates a ratio between two moving averages that are used for the PI Cycle Top indicator. The PI Cycle Top indicator triggers when the 111-day simple moving average (111D SMA) crosses up with the 350-day simple moving average (350D SMA *2).
The line value is ratio is calculated as:
Line Value = 111DSMA / (350D SMA × 2)
When the 111D SMA crosses with the 350D SMA triggering the PI Cycle Top, the value of the ratio between the two lines is 1.
This visualizes the ratio between the two moving averages into a single line. This indicator can be used for technical analysis for historical and future moves.
開源腳本
秉持TradingView一貫精神,這個腳本的創作者將其設為開源,以便交易者檢視並驗證其功能。向作者致敬!您可以免費使用此腳本,但請注意,重新發佈代碼需遵守我們的社群規範。
免責聲明
這些資訊和出版物並非旨在提供,也不構成TradingView提供或認可的任何形式的財務、投資、交易或其他類型的建議或推薦。請閱讀使用條款以了解更多資訊。
免責聲明
這些資訊和出版物並非旨在提供,也不構成TradingView提供或認可的任何形式的財務、投資、交易或其他類型的建議或推薦。請閱讀使用條款以了解更多資訊。