PROTECTED SOURCE SCRIPT
已更新 Radial Basis Kernel RSI [Custom]
What is the Radial Basis Kernel RSI?
This indicator is a sophisticated and adaptive version of the classic Relative Strength Index (RSI). Unlike a standard RSI, which uses a simple moving average to calculate momentum, this indicator employs a powerful statistical method called a Radial Basis Function (RBF) kernel.
This kernel makes the indicator's momentum line more dynamic and responsive to changing market conditions. It works by giving more weight to recent price changes that are similar to the current price action, resulting in a more intelligent and adaptive signal. The final line you see is a Double Exponential Moving Average (DEMA) of the RBF Kernel RSI, which provides extra smoothing to filter out noise and reduce false signals.
How to Interpret and Use the Indicator
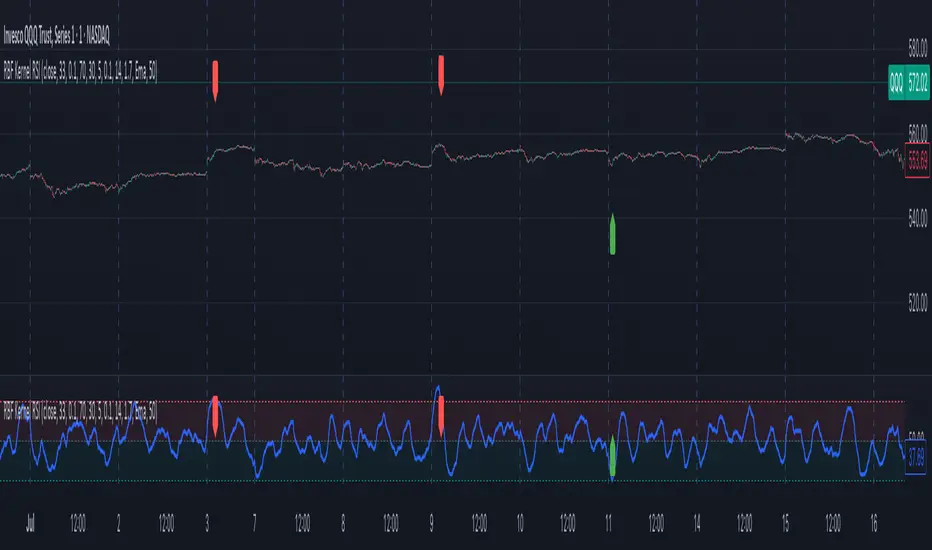
The core purpose of this indicator is to identify potential shifts in momentum and spot overbought or oversold conditions that could precede a reversal.
Buy Signal: Look for the indicator line to cross above the oversold level (default 20), which may also be marked by a green up-arrow. This suggests that the downward momentum is fading and a potential upward reversal or bounce is about to occur.
Sell Signal: Look for the indicator line to cross below the overbought level (default 80), which may also be marked by a red down-arrow. This indicates that the upward momentum is overextended and a potential reversal or pullback could be coming.
How Adjustments Impact the Indicator's Visual Output
Think of the settings as controls that fine-tune the indicator's behavior. By adjusting them, you can make the indicator more or less sensitive to price changes.
1. RSI Kernel Length
This setting controls the time frame the indicator looks at.
Decrease the length: The line becomes more sensitive and "nervous." It will have more frequent, sharper swings and will enter the Overbought and Oversold zones more often. This provides more signals but can also lead to more false readings.
Increase the length: The line becomes smoother and less reactive. It will take longer to change direction and will enter the extreme zones less frequently. This provides fewer signals, but they are generally considered more reliable and are better suited for identifying longer-term trends.
2. Gamma Adjustment Factor
This is the unique "focus" control of the RBF kernel.
Decrease the gamma factor: The line becomes smoother and more dampened. The kernel's influence is spread out, making it less reactive to sudden but minor price changes.
Increase the gamma factor: The line becomes more focused and "spiky." The kernel gives a lot more weight to the most recent, similar-looking price action, which can make the line react very quickly. This can be useful for spotting quick changes but may also introduce more noise.
3. Overbought/Oversold Levels
These are the trigger lines for your signals.
Increase the Overbought level (e.g., from 80 to 90) or decrease the Oversold level (e.g., from 20 to 10): The indicator line will have to make a more extreme move to trigger a signal. You will get fewer signals, but the ones you do get will represent more significant and powerful moves.
Decrease the Overbought level or increase the Oversold level: The line will trigger signals more easily and frequently. This can be useful in ranging markets but may lead to more false signals in strong, trending markets.
4. Moving Average Period (for DEMA)
This setting controls the final smoothing of the line.
Decrease the period: The final line will be more reactive and look "choppier." It will follow the underlying RBF RSI more closely, providing signals with less lag.
Increase the period: The final line will be significantly smoother. It will be much slower to react to price changes, which reduces noise but can also delay your entry or exit signals.
This indicator is a sophisticated and adaptive version of the classic Relative Strength Index (RSI). Unlike a standard RSI, which uses a simple moving average to calculate momentum, this indicator employs a powerful statistical method called a Radial Basis Function (RBF) kernel.
This kernel makes the indicator's momentum line more dynamic and responsive to changing market conditions. It works by giving more weight to recent price changes that are similar to the current price action, resulting in a more intelligent and adaptive signal. The final line you see is a Double Exponential Moving Average (DEMA) of the RBF Kernel RSI, which provides extra smoothing to filter out noise and reduce false signals.
How to Interpret and Use the Indicator
The core purpose of this indicator is to identify potential shifts in momentum and spot overbought or oversold conditions that could precede a reversal.
Buy Signal: Look for the indicator line to cross above the oversold level (default 20), which may also be marked by a green up-arrow. This suggests that the downward momentum is fading and a potential upward reversal or bounce is about to occur.
Sell Signal: Look for the indicator line to cross below the overbought level (default 80), which may also be marked by a red down-arrow. This indicates that the upward momentum is overextended and a potential reversal or pullback could be coming.
How Adjustments Impact the Indicator's Visual Output
Think of the settings as controls that fine-tune the indicator's behavior. By adjusting them, you can make the indicator more or less sensitive to price changes.
1. RSI Kernel Length
This setting controls the time frame the indicator looks at.
Decrease the length: The line becomes more sensitive and "nervous." It will have more frequent, sharper swings and will enter the Overbought and Oversold zones more often. This provides more signals but can also lead to more false readings.
Increase the length: The line becomes smoother and less reactive. It will take longer to change direction and will enter the extreme zones less frequently. This provides fewer signals, but they are generally considered more reliable and are better suited for identifying longer-term trends.
2. Gamma Adjustment Factor
This is the unique "focus" control of the RBF kernel.
Decrease the gamma factor: The line becomes smoother and more dampened. The kernel's influence is spread out, making it less reactive to sudden but minor price changes.
Increase the gamma factor: The line becomes more focused and "spiky." The kernel gives a lot more weight to the most recent, similar-looking price action, which can make the line react very quickly. This can be useful for spotting quick changes but may also introduce more noise.
3. Overbought/Oversold Levels
These are the trigger lines for your signals.
Increase the Overbought level (e.g., from 80 to 90) or decrease the Oversold level (e.g., from 20 to 10): The indicator line will have to make a more extreme move to trigger a signal. You will get fewer signals, but the ones you do get will represent more significant and powerful moves.
Decrease the Overbought level or increase the Oversold level: The line will trigger signals more easily and frequently. This can be useful in ranging markets but may lead to more false signals in strong, trending markets.
4. Moving Average Period (for DEMA)
This setting controls the final smoothing of the line.
Decrease the period: The final line will be more reactive and look "choppier." It will follow the underlying RBF RSI more closely, providing signals with less lag.
Increase the period: The final line will be significantly smoother. It will be much slower to react to price changes, which reduces noise but can also delay your entry or exit signals.
發行說明
updated length受保護腳本
此腳本以閉源形式發佈。 不過,您可以自由且不受任何限制地使用它 — 在此處了解更多資訊。
免責聲明
這些資訊和出版物並不意味著也不構成TradingView提供或認可的金融、投資、交易或其他類型的意見或建議。請在使用條款閱讀更多資訊。
免責聲明
這些資訊和出版物並不意味著也不構成TradingView提供或認可的金融、投資、交易或其他類型的意見或建議。請在使用條款閱讀更多資訊。