PROTECTED SOURCE SCRIPT
已更新 wedges and flags
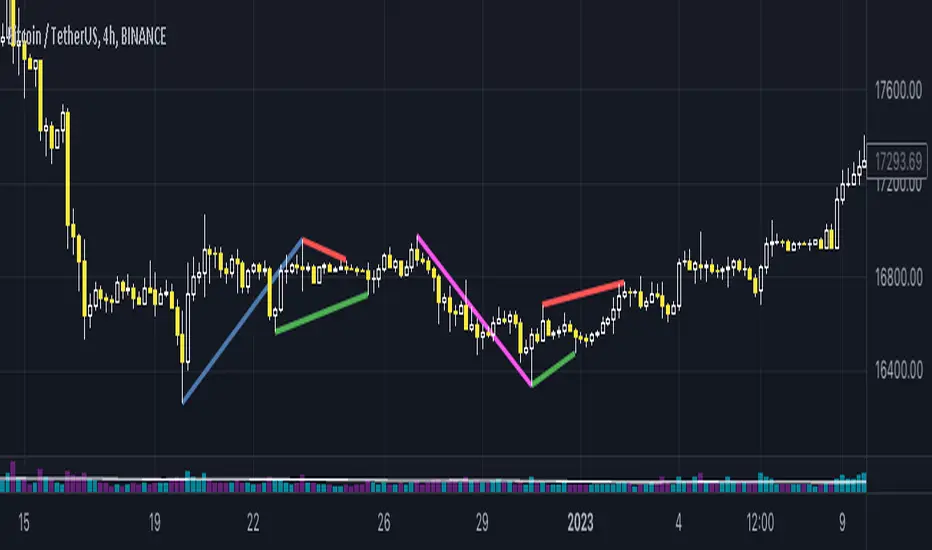
This script identifies chart patterns: wedges, flags, triangles on the chart
It has many settings. You can choose by which extremums you want to identify patterns - by the edges of wicks (tails, shadows), or by the edges of candle bodies.
You can also adjust the accuracy - how smooth and accurate the shapes must be in order for them to be considered wedges or triangles.
You can also customize other parameters of the figure, for example, how long the flagpole should be in order to consider such a figure a wedge, a flag or a triangle.
You can also set how large the allowable spread of candles relative to the flagpole can be.
The Sensitivity parameter - will allow you to control the number of patterns detected depending on whether you want the patterns to be detected more often, or if they cover more candles and thus be more reliable
You can also customize your styles.
All key settings are accompanied by tooltips
發行說明
Corrected wording受保護腳本
此腳本以閉源形式發佈。 不過,您可以自由使用,沒有任何限制 — 點擊此處了解更多。
免責聲明
這些資訊和出版物並非旨在提供,也不構成TradingView提供或認可的任何形式的財務、投資、交易或其他類型的建議或推薦。請閱讀使用條款以了解更多資訊。
免責聲明
這些資訊和出版物並非旨在提供,也不構成TradingView提供或認可的任何形式的財務、投資、交易或其他類型的建議或推薦。請閱讀使用條款以了解更多資訊。