OPEN-SOURCE SCRIPT
已更新 Ultimate Relative Strength
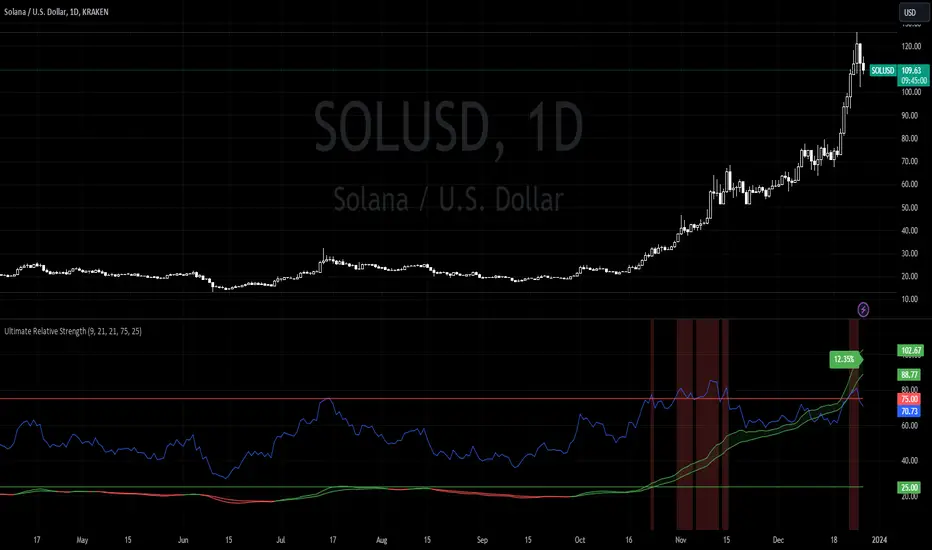
Ema 9 and 21 crossover bands. Green for positive trend, red for negative. It then calculates the distance between the bands and plots the distance as a percentage compared to the overall asset price.
Relative strength index with overbought and oversold levels (customizable). Green columns could be a good place to DCA. Red columns for marking local tops.
By recording the RS % amongst a list of assets, you can determine Salxx's RS Ranking from highest to lowest. A high ranking % inside a red column suggests short term dip or sideways movement. Not the best time to buy in. Monitor until consolidation between overbought and oversold levels. If RS ranking still high, now time to buy in.
發行說明
..發行說明
.開源腳本
秉持TradingView一貫精神,這個腳本的創作者將其設為開源,以便交易者檢視並驗證其功能。向作者致敬!您可以免費使用此腳本,但請注意,重新發佈代碼需遵守我們的社群規範。
免責聲明
這些資訊和出版物並非旨在提供,也不構成TradingView提供或認可的任何形式的財務、投資、交易或其他類型的建議或推薦。請閱讀使用條款以了解更多資訊。
免責聲明
這些資訊和出版物並非旨在提供,也不構成TradingView提供或認可的任何形式的財務、投資、交易或其他類型的建議或推薦。請閱讀使用條款以了解更多資訊。