OPEN-SOURCE SCRIPT
Sector ETFs performance overview
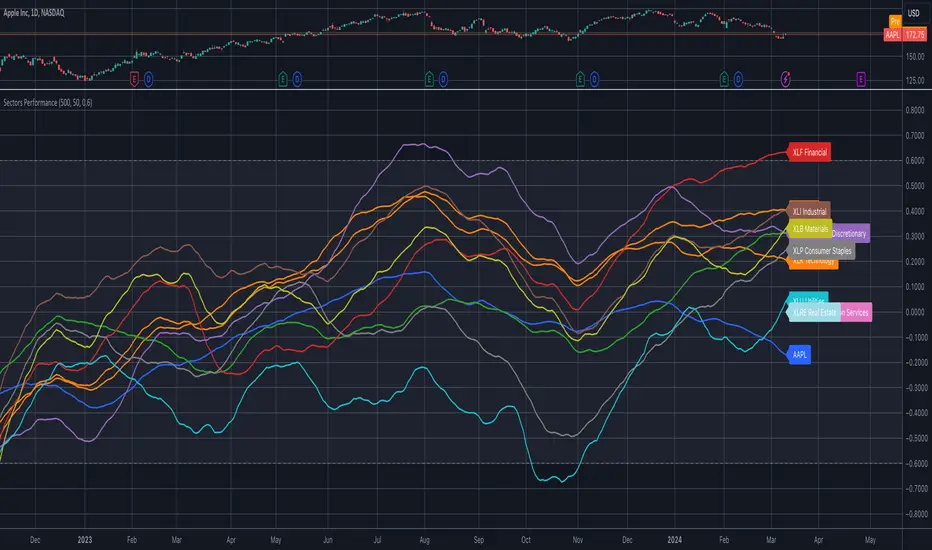
The indicator provides a nuanced view of sector performance through ETF analysis, focusing on long-term price trends and deviations from these trends to gauge relative strength or weakness. It utilizes a methodical approach to smooth out ETF price data and then applies a regression analysis to pinpoint the primary trend direction. By examining how far the current price deviates from this regression line, the indicator identifies potential overbought or oversold conditions within various sectors.
Core Analysis Techniques:
Adaptability and Insight:
Strategic Application:
Focusing on trend and volatility analysis rather than direct trading signals, the indicator aids in forming a strategic view of sector investments. It's particularly useful for:
This tool stands out as a vital resource for analyzing sector-level market trends, offering detailed insights into the dynamics of economic sectors for comprehensive market analysis.
Core Analysis Techniques:
- Logarithmic Transformation and Regression: This process transforms ETF closing prices on a logarithmic scale to better understand sector growth patterns and dynamics. A linear regression of these prices helps define the overarching trend, crucial for understanding market movements.
- Volatility Bands for Market State Assessment: The indicator calculates standard deviation based on logarithmic prices to establish dynamic bands around the regression line. These bands are instrumental in identifying market states, highlighting when sectors may be overextended from their central trend.
- Sector-Specific Analysis: By focusing on distinct sector ETFs, the tool enables targeted analysis across various market segments. This specificity allows for a granular look at sectors like technology, healthcare, and financials, providing insights tailored to each area.
Adaptability and Insight:
- Customizable Parameters: The indicator offers users the ability to adjust key parameters such as regression length and smoothing factors. This customization ensures that the analysis can be tailored to individual preferences and market outlooks.
- Trend Direction and Momentum: It assesses the ETF's price movement relative to historical data and the established volatility bands, helping to clarify the sector's trend strength and potential directional shifts.
Strategic Application:
Focusing on trend and volatility analysis rather than direct trading signals, the indicator aids in forming a strategic view of sector investments. It's particularly useful for:
- Spotting macroeconomic trends through the lens of sector ETF performance.
- Informing portfolio decisions with nuanced insights into sector momentum and market conditions.
- Anticipating potential market shifts by evaluating how current prices align with historical volatility and trend patterns.
This tool stands out as a vital resource for analyzing sector-level market trends, offering detailed insights into the dynamics of economic sectors for comprehensive market analysis.
開源腳本
秉持TradingView一貫精神,這個腳本的創作者將其設為開源,以便交易者檢視並驗證其功能。向作者致敬!您可以免費使用此腳本,但請注意,重新發佈代碼需遵守我們的社群規範。
Dmytro S.
免責聲明
這些資訊和出版物並非旨在提供,也不構成TradingView提供或認可的任何形式的財務、投資、交易或其他類型的建議或推薦。請閱讀使用條款以了解更多資訊。
開源腳本
秉持TradingView一貫精神,這個腳本的創作者將其設為開源,以便交易者檢視並驗證其功能。向作者致敬!您可以免費使用此腳本,但請注意,重新發佈代碼需遵守我們的社群規範。
Dmytro S.
免責聲明
這些資訊和出版物並非旨在提供,也不構成TradingView提供或認可的任何形式的財務、投資、交易或其他類型的建議或推薦。請閱讀使用條款以了解更多資訊。