INVITE-ONLY SCRIPT
已更新 Demand Supply Screener 1.0
The Demand Supply Screener helps in identifying symbols that are trading close to or inside Demand Supply Zones. You can provide a list of up to 40 symbols to the screener.
The more the number of symbols or smaller the time frame, the longer it will take for the screener to shortlist symbols. This can result in a calculation timeout. In such a case, you can reduce the number of symbols in the list by splitting it into multiple charts/indicators until the error is resolved.
Use "Proximity %" to filter symbols, for example, if you set it to 2%, the screener will shortlist symbols where the high/low of the time frame you are on is within 2% proximity of the supply/demand zone respectively.
For shortlisting symbols that are currently touching demand supply zones or trading inside of them use Proximity % as 0 and ensure Show Tested Zones is enabled.
發行說明
Option added to check the Exchange and Symbol name on the chart.發行說明
A new option has been added to choose the proximity method using High/Low or Close price.發行說明
Now select symbols from indicator settings.發行說明
Enhancements and bug fixes.發行說明
Bug fix and indicator optimization發行說明
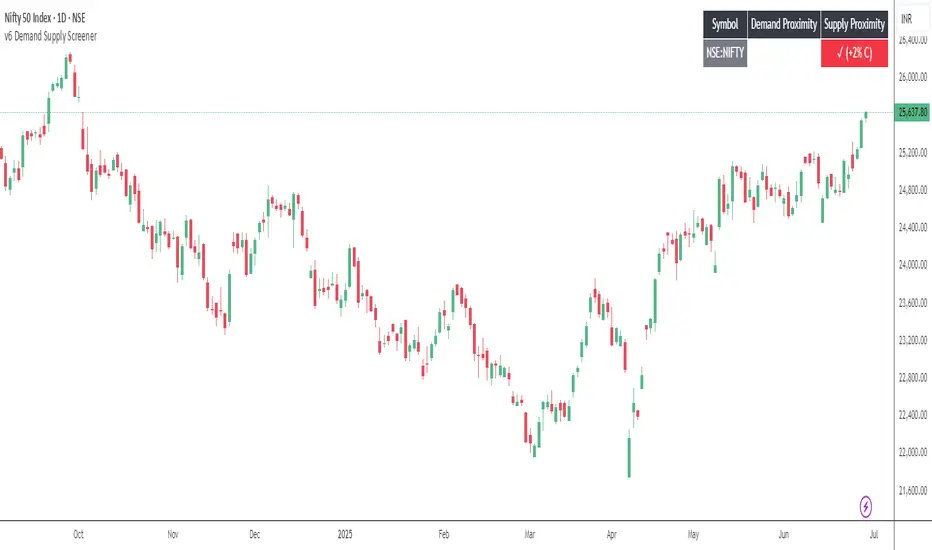
v6 Demand Supply ScreenerThe Demand Supply Screener is a powerful tool designed to help traders quickly identify the best demand and supply zone opportunities across multiple symbols, all in one place. It uses advanced zone detection logic inspired by institutional trading methods to highlight where strong buying (demand) or selling (supply) imbalances exist, allowing you to focus only on high-probability setups. The screener helps you identify symbols that are trading close to or inside demand and supply zones, so you can quickly spot potential opportunities without manual chart scanning.
Key Features
Multi-Symbol Screening
Analyze up to 15 symbols simultaneously. Monitor major indices, forex pairs, commodities, or stocks at the same time without switching charts.
Advanced Pattern Detection
Detects strong demand and supply zones using patterns such as Gap, Regular, and Follow-Through. Focus on the setups that matter most.
Dynamic Table Display
Cleanly displays symbol names, pattern details, and proximity data directly on your chart in a table format. Stay organized and make faster decisions.
Customizable Filtering
Choose which pattern types to include, set proximity thresholds, and filter symbols based on your strategy needs.
發行說明
Fixed bug in gap zone.發行說明
Improved table display for zone distance metrics:When the price is outside a zone:
• For demand zones, if the zone is below the current closing price, the distance will be shown as a negative percentage. This indicates the price needs to move down by that percentage to reach the demand zone proximal line.
• For supply zones, if the zone is above the current price, the distance will be shown as a positive percentage, showing how much the price needs to move up to reach the supply zone.
When the price is already inside a zone:
• For demand zones, the distance is shown as a positive percentage, indicating how much the price must move up to exit the zone.
• For supply zones, the distance is shown as a negative percentage, indicating how much the price needs to drop to leave the zone.
This update provides a clearer and more intuitive view of how far the price is from each zone or how much it needs to move to exit a zone if already inside.
發行說明
We’ve enhanced the Demand Supply Screener!Now, along with the percentage proximity to the zone, the screener also indicates whether the current price is INSIDE or OUTSIDE the zone:
- IN → Price is within the demand or supply zone
- OUT → Price is outside the zone
This helps you make quicker, more informed trading decisions at a glance.
僅限邀請腳本
只有經作者批准的使用者才能訪問此腳本。您需要申請並獲得使用權限。該權限通常在付款後授予。如欲了解更多詳情,請依照以下作者的說明操作,或直接聯絡SurjeetKakkar。
除非您完全信任其作者並了解腳本的工作原理,否則TradingView不建議您付費或使用腳本。您也可以在我們的社群腳本中找到免費的開源替代方案。
作者的說明
It's a subscription-based screener, you can subscribe to it from our website.
提醒:在請求訪問權限之前,請閱讀僅限邀請腳本指南。
免責聲明
這些資訊和出版物並不意味著也不構成TradingView提供或認可的金融、投資、交易或其他類型的意見或建議。請在使用條款閱讀更多資訊。