OPEN-SOURCE SCRIPT
Z-Score
Description:
The Z-Score indicator is a powerful tool for assessing the relative position of a financial instrument's current price compared to its historical price data. It calculates the Z-Score, which is a statistical measure of how many standard deviations an asset's current price is away from its historical mean. This can help traders identify overbought and oversold conditions in the market.
Input Parameters:
Length: This parameter sets the look-back period for calculating the mean and standard deviation. It is set to 20 by default but can be adjusted according to your trading preferences.
How it works:
The indicator first calculates the mean (average) and standard deviation of the selected price source (default: closing prices) over the specified length.
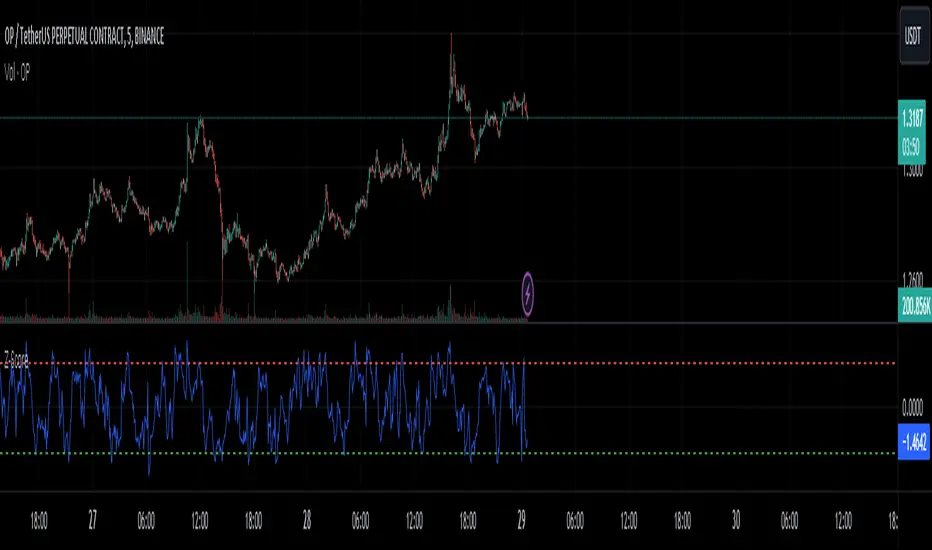
The Z-Score is then computed by measuring how many standard deviations the current price is away from the mean. This value is plotted on the chart, providing insight into the current price's relative position.
Usage:
Overbought: When the Z-Score rises above the upper threshold (e.g., +2 standard deviations, shown in red), it suggests that the asset's price is significantly above its historical average, indicating a potential overbought condition. Traders might consider this as a signal to be cautious about entering long positions or to look for potential short opportunities.
Oversold: Conversely, when the Z-Score falls below the lower threshold (e.g., -2 standard deviations, shown in green), it suggests that the asset's price is significantly below its historical average, indicating a potential oversold condition. Traders might consider this as a signal to be cautious about entering short positions or to look for potential long opportunities.
The Z-Score indicator can be a valuable addition to your technical analysis toolkit, helping you make informed trading decisions based on statistical price deviations.
Please make sure to conduct thorough backtesting and combine this indicator with other analysis techniques before making any trading decisions.
The Z-Score indicator is a powerful tool for assessing the relative position of a financial instrument's current price compared to its historical price data. It calculates the Z-Score, which is a statistical measure of how many standard deviations an asset's current price is away from its historical mean. This can help traders identify overbought and oversold conditions in the market.
Input Parameters:
Length: This parameter sets the look-back period for calculating the mean and standard deviation. It is set to 20 by default but can be adjusted according to your trading preferences.
How it works:
The indicator first calculates the mean (average) and standard deviation of the selected price source (default: closing prices) over the specified length.
The Z-Score is then computed by measuring how many standard deviations the current price is away from the mean. This value is plotted on the chart, providing insight into the current price's relative position.
Usage:
Overbought: When the Z-Score rises above the upper threshold (e.g., +2 standard deviations, shown in red), it suggests that the asset's price is significantly above its historical average, indicating a potential overbought condition. Traders might consider this as a signal to be cautious about entering long positions or to look for potential short opportunities.
Oversold: Conversely, when the Z-Score falls below the lower threshold (e.g., -2 standard deviations, shown in green), it suggests that the asset's price is significantly below its historical average, indicating a potential oversold condition. Traders might consider this as a signal to be cautious about entering short positions or to look for potential long opportunities.
The Z-Score indicator can be a valuable addition to your technical analysis toolkit, helping you make informed trading decisions based on statistical price deviations.
Please make sure to conduct thorough backtesting and combine this indicator with other analysis techniques before making any trading decisions.
開源腳本
秉持TradingView一貫精神,這個腳本的創作者將其設為開源,以便交易者檢視並驗證其功能。向作者致敬!您可以免費使用此腳本,但請注意,重新發佈代碼需遵守我們的社群規範。
免責聲明
這些資訊和出版物並非旨在提供,也不構成TradingView提供或認可的任何形式的財務、投資、交易或其他類型的建議或推薦。請閱讀使用條款以了解更多資訊。
開源腳本
秉持TradingView一貫精神,這個腳本的創作者將其設為開源,以便交易者檢視並驗證其功能。向作者致敬!您可以免費使用此腳本,但請注意,重新發佈代碼需遵守我們的社群規範。
免責聲明
這些資訊和出版物並非旨在提供,也不構成TradingView提供或認可的任何形式的財務、投資、交易或其他類型的建議或推薦。請閱讀使用條款以了解更多資訊。