OPEN-SOURCE SCRIPT
已更新 Relative Momentum Index

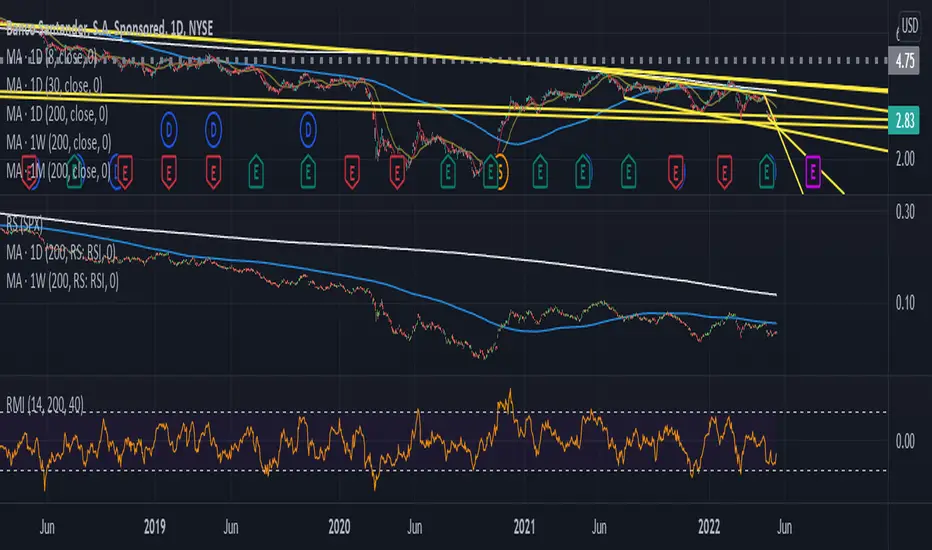
The RMI indicator is intended as a general upgrade to the RSI indicator based on logical improvements to the underlying mathematics of the RSI function.
The first change is that the RMI indicator uses the maximal change in price in both directions rather than simply the change in the closing price to better capture the relative momentum in each direction. The second change is that the the ratio between bullishness and bearishness is passed through a log function rather than the 1/(1+x) function to remove the processing artefacts caused by the EMAs and the compression within the restricted range. As a result, the RMI is an unbounded centred oscillator, although it is usually at a similar value to the RSI indicator doubled and centred at zero. The bands are intended to make differences between values more visible at a glance and for interface familiarity with the RSI indicator, though their levels are arbitrary and not intended as overbought/oversold signals.
The practical effect of these changes are that divergences are easier to see since the indicator is not compressed at extreme values and divergence strategies based on the RMI indicator are slightly more accurate. The list of occasions on the included DJI Weekly chart where the RMI divergence strategy correctly predicted a reversal while the RSI did not are as follows: July 1932, June 1962, May 1970, November 1987, May 2021
發行說明
Algorithm is more similar to the ATR algorithm it was inspired by and has an improvement in the way gaps are interpreted.開源腳本
秉持TradingView一貫精神,這個腳本的創作者將其設為開源,以便交易者檢視並驗證其功能。向作者致敬!您可以免費使用此腳本,但請注意,重新發佈代碼需遵守我們的社群規範。
免責聲明
這些資訊和出版物並非旨在提供,也不構成TradingView提供或認可的任何形式的財務、投資、交易或其他類型的建議或推薦。請閱讀使用條款以了解更多資訊。
開源腳本
秉持TradingView一貫精神,這個腳本的創作者將其設為開源,以便交易者檢視並驗證其功能。向作者致敬!您可以免費使用此腳本,但請注意,重新發佈代碼需遵守我們的社群規範。
免責聲明
這些資訊和出版物並非旨在提供,也不構成TradingView提供或認可的任何形式的財務、投資、交易或其他類型的建議或推薦。請閱讀使用條款以了解更多資訊。