OPEN-SOURCE SCRIPT
Minimum Variance SMA
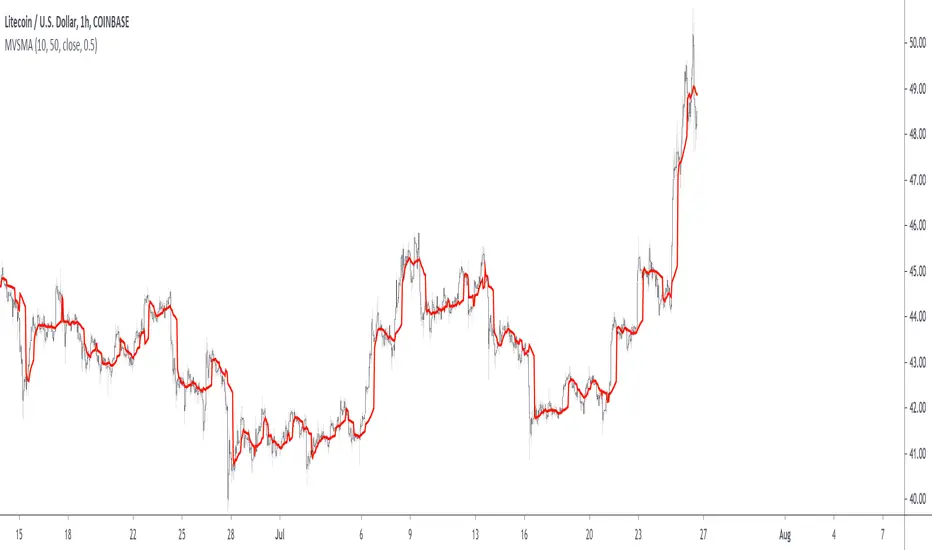
Return the value of a simple moving average with a period within the range min to max such that the variance of the same period is the smallest available.
Since the smallest variance is often the one with the smallest period, a penalty setting is introduced, and allows the indicator to return moving averages values with higher periods more often, with higher penalty values returning moving averages values with higher periods.
Because variances with smaller periods are more reactive than ones with higher periods, it is common for the indicator to return the value of an SMA of a higher period during more volatile market, this can be seen on the image below:

here variances from period 10 to 15 are plotted, a blueish color represents a higher period, note how they are the smallest ones when fluctuations are more volatile.

Indicator with min = 50, max = 200 and penalty = 0.5

In blue the indicator with penalty = 0, in red with penalty = 1, with both min = 50 and max = 200.
On The Script
The script minimize Var(i)/p with i ∈ (min,max) and p = i^penalty, this is done by computing the variance for each period i and keeping the smallest one currently in the loop, if we get a variance value smaller than the previously one found we calculate the value of an SMA with period i, as such the script deal with brute force optimization.
For our use case it is not possible to use the built-in sma and variance functions within a loop, as such we use cumulative forms for both functions.
Since the smallest variance is often the one with the smallest period, a penalty setting is introduced, and allows the indicator to return moving averages values with higher periods more often, with higher penalty values returning moving averages values with higher periods.
Because variances with smaller periods are more reactive than ones with higher periods, it is common for the indicator to return the value of an SMA of a higher period during more volatile market, this can be seen on the image below:
here variances from period 10 to 15 are plotted, a blueish color represents a higher period, note how they are the smallest ones when fluctuations are more volatile.
Indicator with min = 50, max = 200 and penalty = 0.5
In blue the indicator with penalty = 0, in red with penalty = 1, with both min = 50 and max = 200.
On The Script
The script minimize Var(i)/p with i ∈ (min,max) and p = i^penalty, this is done by computing the variance for each period i and keeping the smallest one currently in the loop, if we get a variance value smaller than the previously one found we calculate the value of an SMA with period i, as such the script deal with brute force optimization.
For our use case it is not possible to use the built-in sma and variance functions within a loop, as such we use cumulative forms for both functions.
開源腳本
秉持TradingView一貫精神,這個腳本的創作者將其設為開源,以便交易者檢視並驗證其功能。向作者致敬!您可以免費使用此腳本,但請注意,重新發佈代碼需遵守我們的社群規範。
Check out the indicators we are making at luxalgo: tradingview.com/u/LuxAlgo/
"My heart is so loud that I can't hear the fireworks"
"My heart is so loud that I can't hear the fireworks"
免責聲明
這些資訊和出版物並非旨在提供,也不構成TradingView提供或認可的任何形式的財務、投資、交易或其他類型的建議或推薦。請閱讀使用條款以了解更多資訊。