PROTECTED SOURCE SCRIPT
BloodSwing Indicator
-SWING TRADING STRATEGY FOR PASSIVE TRADERS-
A Multi-timeframe Strategy
This swing trading strategy uses three moving averages pegged to the 4H timeframe, to enter and exit the market on the 1H timeframe.
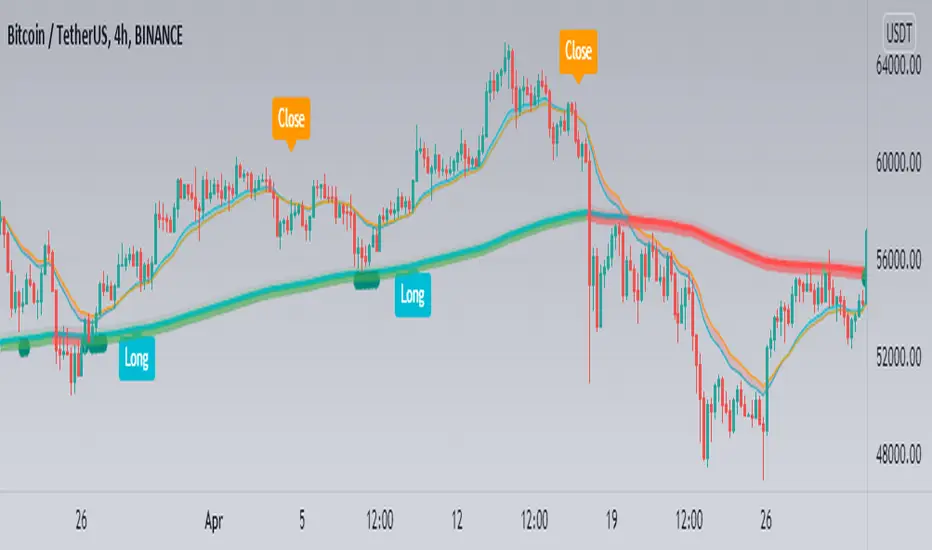
The 200 EMA (4H timeframe) is used to identify areas of support. If this moving average shows signs of support (shown as green circles under candles), the 18 and 22 moving average (4hour timeframe) crossover is used to enter the market, but on the 1 hour chart (for more accuracy) and only after an increase in volume on the 1 hour timeframe has been detected.
Manually this strategy is explained as follows:
1. Look for candle support on 200 MA (4H Timeframe)
2. On the 1H chart, look for the crossover of 18 and 22 ma (4H Timeframe)
3. As soon as you see volume increase on 1H, enter.
4. Exit on cross under of 18 and 22 ma (4H Timeframe)
5. Stop Loss below 200EMA support candle low.
Signals:
- Support signals are shown as green circles under the candles
- Long, Close, Stop signals are shown as labels and can be toggled on and off.
Extras (In option menu):
MA Deviation:
A standard deviation measure used on the 200 EMA in order to provide some range for support signals to be considered valid.
Use volume expansion for entry:
As an option (on by default), you can disable volume increase as a condition for entry.
A Multi-timeframe Strategy
This swing trading strategy uses three moving averages pegged to the 4H timeframe, to enter and exit the market on the 1H timeframe.
The 200 EMA (4H timeframe) is used to identify areas of support. If this moving average shows signs of support (shown as green circles under candles), the 18 and 22 moving average (4hour timeframe) crossover is used to enter the market, but on the 1 hour chart (for more accuracy) and only after an increase in volume on the 1 hour timeframe has been detected.
Manually this strategy is explained as follows:
1. Look for candle support on 200 MA (4H Timeframe)
2. On the 1H chart, look for the crossover of 18 and 22 ma (4H Timeframe)
3. As soon as you see volume increase on 1H, enter.
4. Exit on cross under of 18 and 22 ma (4H Timeframe)
5. Stop Loss below 200EMA support candle low.
Signals:
- Support signals are shown as green circles under the candles
- Long, Close, Stop signals are shown as labels and can be toggled on and off.
Extras (In option menu):
MA Deviation:
A standard deviation measure used on the 200 EMA in order to provide some range for support signals to be considered valid.
Use volume expansion for entry:
As an option (on by default), you can disable volume increase as a condition for entry.
受保護腳本
此腳本以閉源形式發佈。 不過,您可以自由且不受任何限制地使用它 — 在此處了解更多資訊。
“If you personalize losses, you can't trade.”
免責聲明
這些資訊和出版物並不意味著也不構成TradingView提供或認可的金融、投資、交易或其他類型的意見或建議。請在使用條款閱讀更多資訊。
受保護腳本
此腳本以閉源形式發佈。 不過,您可以自由且不受任何限制地使用它 — 在此處了解更多資訊。
“If you personalize losses, you can't trade.”
免責聲明
這些資訊和出版物並不意味著也不構成TradingView提供或認可的金融、投資、交易或其他類型的意見或建議。請在使用條款閱讀更多資訊。