INVITE-ONLY SCRIPT
Custom Fibonacci Support & Resistance Lines
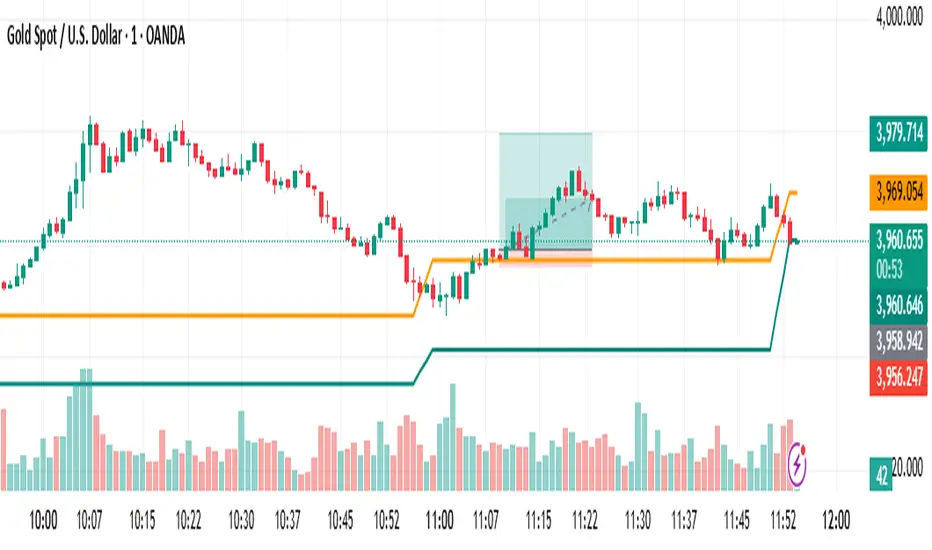
Custom Fibonacci Support & Resistance Lines automatically plots dynamic 0.618-style Fibonacci levels based on recent swing highs and lows.
The script detects the latest confirmed swing high and swing low on the chart and calculates two adaptive lines:
A Fibonacci Support Line below price (retracement from swing high to swing low).
A Fibonacci Resistance Line above price (retracement from swing low to swing high).
Both levels are smoothed using a simple moving average for a cleaner visual appearance — similar to an adaptive support/resistance band that follows recent market structure.
⚙️ Features
🔹 Auto-detects swing highs & lows using left/right bar pivots.
🔹 Adjustable Fibonacci levels for both Support and Resistance.
🔹 Adjustable smoothing length for smoother or more reactive lines.
🔹 Works across any timeframe and instrument.
🔹 Ideal for spotting potential reversal zones, trend continuation areas, and dynamic price support/resistance.
🧮 Default Settings
Fibonacci Level (Support) = 0.618
Fibonacci Level (Resistance) = 0.618
Left/Right Swing Bars = 5 / 5
Smoothing Length = 3
💡 Usage Tips
Combine these dynamic Fibonacci lines with trend indicators (EMA, RSI, or structure breaks) to confirm entries.
Increase Left/Right Swing Bars for stronger structural pivots on higher timeframes.
Change Fibonacci Levels (e.g., 0.382, 0.5, 0.786) to visualize multiple retracement zones.
僅限邀請腳本
只有經作者批准的使用者才能訪問此腳本。您需要申請並獲得使用權限。該權限通常在付款後授予。如欲了解更多詳情,請依照以下作者的說明操作,或直接聯絡ChartTechnical。
除非您完全信任其作者並了解腳本的工作原理,否則TradingView不建議您付費或使用腳本。您也可以在我們的社群腳本中找到免費的開源替代方案。
作者的說明
drop a message to me
免責聲明
這些資訊和出版物並不意味著也不構成TradingView提供或認可的金融、投資、交易或其他類型的意見或建議。請在使用條款閱讀更多資訊。
僅限邀請腳本
只有經作者批准的使用者才能訪問此腳本。您需要申請並獲得使用權限。該權限通常在付款後授予。如欲了解更多詳情,請依照以下作者的說明操作,或直接聯絡ChartTechnical。
除非您完全信任其作者並了解腳本的工作原理,否則TradingView不建議您付費或使用腳本。您也可以在我們的社群腳本中找到免費的開源替代方案。
作者的說明
drop a message to me
免責聲明
這些資訊和出版物並不意味著也不構成TradingView提供或認可的金融、投資、交易或其他類型的意見或建議。請在使用條款閱讀更多資訊。