OPEN-SOURCE SCRIPT
已更新 Constance Brown RSI
*Re-uploading without House Violations*
Welles Wilder created the RSI momentum oscillator in the 1970s. It is a momentum oscillator that ranges from 0 to 100. The traditional idea is to buy when the oscillator is below 30 and to sell when it is above 70. However, this strategy often only catches extreme moves and misses majority of the trend.
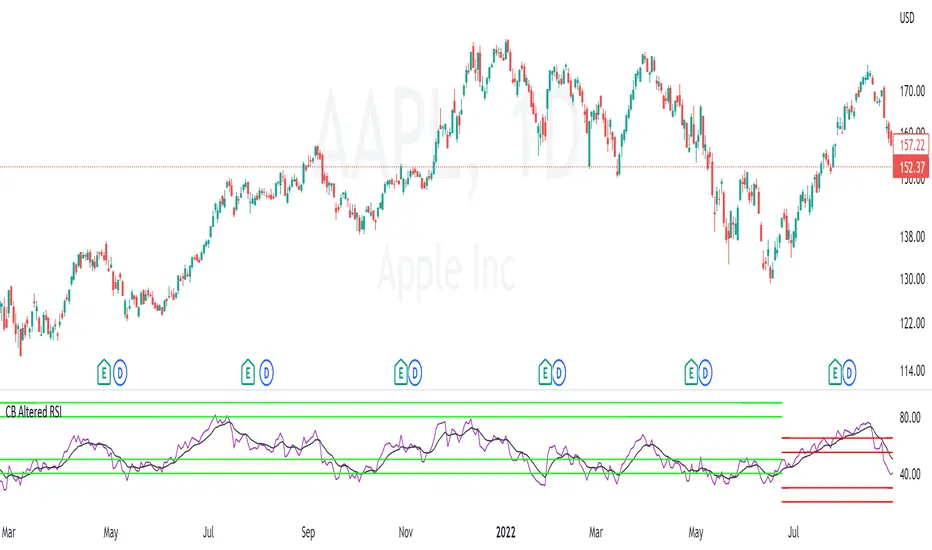
In comes Constance Brown RSI . She theorized that in an uptrend, the buy zone exists when RSI is between 40 and 50. The sell zone in an uptrend exists between 80 and 90. In a downtrend, the sell zone exists between 55 and 65. The buy zone in a downtrend exists between 20 and 30.
I have added a moving average feature to determine trend. When the short trend is above the long trend, it is considered an uptrend. It is in a downtrend otherwise. Using short length moving averages will often produce a lot of false signals. I recommend using the 50 and 100 as they will produce less noise.
There will be times when the oscillator breaks beyond the ranges described (for ex: seeing a reading below 40 in an uptrend). This tends to happen in periods of high volatility . Refer to the traditional RSI rules in such cases.
https://www.tradingview.com/x/of8R82ie
Welles Wilder created the RSI momentum oscillator in the 1970s. It is a momentum oscillator that ranges from 0 to 100. The traditional idea is to buy when the oscillator is below 30 and to sell when it is above 70. However, this strategy often only catches extreme moves and misses majority of the trend.
In comes Constance Brown RSI . She theorized that in an uptrend, the buy zone exists when RSI is between 40 and 50. The sell zone in an uptrend exists between 80 and 90. In a downtrend, the sell zone exists between 55 and 65. The buy zone in a downtrend exists between 20 and 30.
I have added a moving average feature to determine trend. When the short trend is above the long trend, it is considered an uptrend. It is in a downtrend otherwise. Using short length moving averages will often produce a lot of false signals. I recommend using the 50 and 100 as they will produce less noise.
There will be times when the oscillator breaks beyond the ranges described (for ex: seeing a reading below 40 in an uptrend). This tends to happen in periods of high volatility . Refer to the traditional RSI rules in such cases.
https://www.tradingview.com/x/of8R82ie
發行說明
Added an EMA signal line. Buy the crossover from the support zone in an uptrend and sell the crossunder from the resistance zone in a downtrend. 開源腳本
秉持TradingView一貫精神,這個腳本的創作者將其設為開源,以便交易者檢視並驗證其功能。向作者致敬!您可以免費使用此腳本,但請注意,重新發佈代碼需遵守我們的社群規範。
免責聲明
這些資訊和出版物並非旨在提供,也不構成TradingView提供或認可的任何形式的財務、投資、交易或其他類型的建議或推薦。請閱讀使用條款以了解更多資訊。
免責聲明
這些資訊和出版物並非旨在提供,也不構成TradingView提供或認可的任何形式的財務、投資、交易或其他類型的建議或推薦。請閱讀使用條款以了解更多資訊。