OPEN-SOURCE SCRIPT
已更新 Intraday Background Time Ranges
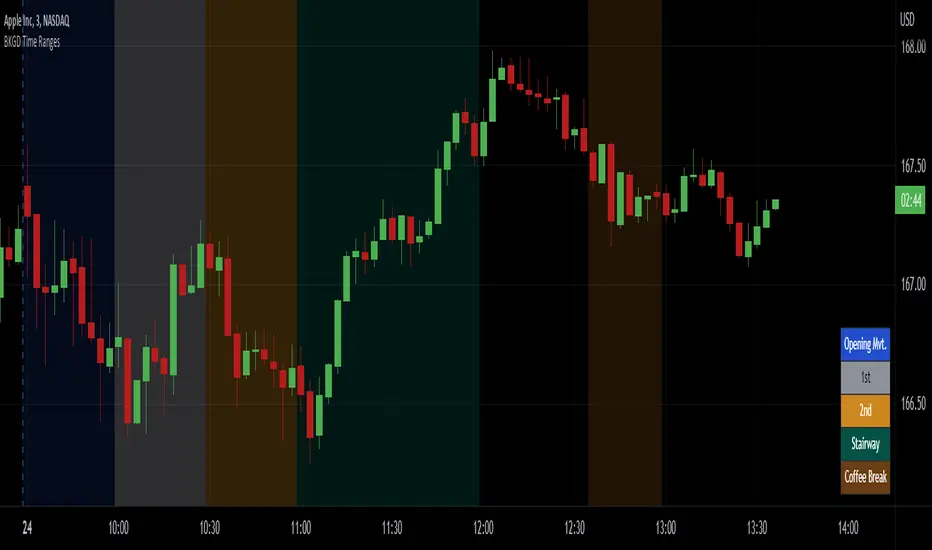
This simple script was written for studying recurring intraday behaviours of financial instruments. With it, you can highlight up to 13 customizable time ranges on your chart, filling the corresponding background space with colors you prefer. You can then write a note for each range and it will be shown in the optional related table.
The experience shows that every financial instrument has its own personality. With this in mind, the script can be useful to study intraday charts with the purpose of discovering recurring behaviours of specific instruments over a certain time range and under specific circumstances (normal days, earnings days, days with catalysts, etc.) This can help the trader to deeply understand the instrument personality, and therefore also to decide whether to enter or exit the market if its behaviour meets or not his expectations.
Please note that this script only works on minute/hourly charts.
發行說明
Minor fix: Now the table won't appear without any text.Cleaned the code.
發行說明
Update:1) Shortened the short title, which now is "Time Ranges".
2) Removed the seconds time frame limitation.
3) Cleaned, simplified and improved the overall appearance of the code.
發行說明
UPDATE:Added 17 additional time ranges, bringing the total to 30.
發行說明
UPDATE:This new version includes the option to choose whether to project the colors ahead of time, allowing you to see them even before the price reaches the specified time.
In order to achieve this purpose, I had to modify the input mode for the time ranges.
發行說明
MINOR UPDATE- Fixed the code that displayed the table frame when the time range was selected even in the absence of text.
- Converted the code to v6.
發行說明
MAJOR UPDATE- Added a new option that lets you choose how the indicator handles time zones:
· Exchange: Time ranges follow the time zone of the current symbol.
· Custom: Select a fixed time zone from a dropdown list to apply across any chart.
Let me know if your time zone is missing, so it can be added in the next update or once at least three requests are collected.
NOTE: If the chart is set to a time zone different from the exchange's, make sure time ranges start after the market opens in the chart’s time zone. Otherwise, they won’t be displayed.
- Time ranges can now be shown on selected weekdays only. The table updates accordingly.
- Improved the way time ranges are shown in advance, eliminating visual flickering.
- Refined the menu layout and made time range inputs more user-friendly.
- Cleaned up the code.
發行說明
Errata corrige:If the chart is set to a time zone different from the exchange's, make sure time ranges end after the market opens in the chart's time zone. Ranges that start before the open will be partially visible if they end after the open.
Explanation:
For example, if the indicator is set with a custom time zone like "Australia/Sydney" on a US stock chart with extended hours enabled, 4 a.m. EST (the start of pre-market) corresponds to 6:00 p.m. in Sydney. Therefore, you need to set a range that starts at 18:00, or at least ends at 18:01 — in the latter case, only one minute of background will be colored.
發行說明
MAJOR FIXFixed the "Anticipate" parameter not working as expected.
發行說明
UPDATEAdded the "Anticipate (Table)" option, which allows displaying all notes or only the one active during the current time range.
開源腳本
本著TradingView的真正精神,此腳本的創建者將其開源,以便交易者可以查看和驗證其功能。向作者致敬!雖然您可以免費使用它,但請記住,重新發佈程式碼必須遵守我們的網站規則。
免責聲明
這些資訊和出版物並不意味著也不構成TradingView提供或認可的金融、投資、交易或其他類型的意見或建議。請在使用條款閱讀更多資訊。
開源腳本
本著TradingView的真正精神,此腳本的創建者將其開源,以便交易者可以查看和驗證其功能。向作者致敬!雖然您可以免費使用它,但請記住,重新發佈程式碼必須遵守我們的網站規則。
免責聲明
這些資訊和出版物並不意味著也不構成TradingView提供或認可的金融、投資、交易或其他類型的意見或建議。請在使用條款閱讀更多資訊。