OPEN-SOURCE SCRIPT
已更新 Candle Thermals
This indicator color candles based on their percentage price change, relative to the average, maximum, and minimum changes over the last 100 candles.
-It calculates the percentage change of all candles
-Calculates the minimum, maximum and average in the last 100 bars in percentage change
-Changes color of the candle based on the range between the current percent and min/max value
-The brightest candle provides the highest compound effect to you account if you act on it at the open.
-Candles that have a percentage close to the average then they are barely visible = lowest compound effect to your account
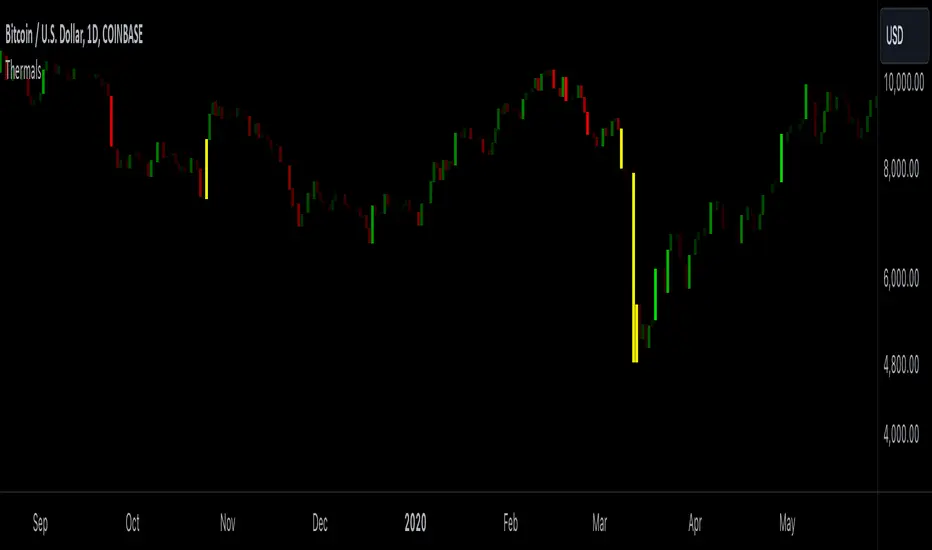
This indicator functions like a "heatmap" for candles, highlighting the relative volatility of price movements in both directions. Strong bullish candles are brighter green, and strong bearish candles are brighter red. It's particularly useful for traders wanting quick visual feedback on price volatility and strength trends within the last 100 bars.
-It calculates the percentage change of all candles
-Calculates the minimum, maximum and average in the last 100 bars in percentage change
-Changes color of the candle based on the range between the current percent and min/max value
-The brightest candle provides the highest compound effect to you account if you act on it at the open.
-Candles that have a percentage close to the average then they are barely visible = lowest compound effect to your account
This indicator functions like a "heatmap" for candles, highlighting the relative volatility of price movements in both directions. Strong bullish candles are brighter green, and strong bearish candles are brighter red. It's particularly useful for traders wanting quick visual feedback on price volatility and strength trends within the last 100 bars.
發行說明
we have made the candles yellow if they reach maximum or minimum values in percentage change. meaning those are the candles which you will achieve the highest compound effect 開源腳本
秉持TradingView一貫精神,這個腳本的創作者將其設為開源,以便交易者檢視並驗證其功能。向作者致敬!您可以免費使用此腳本,但請注意,重新發佈代碼需遵守我們的社群規範。
免責聲明
這些資訊和出版物並非旨在提供,也不構成TradingView提供或認可的任何形式的財務、投資、交易或其他類型的建議或推薦。請閱讀使用條款以了解更多資訊。
免責聲明
這些資訊和出版物並非旨在提供,也不構成TradingView提供或認可的任何形式的財務、投資、交易或其他類型的建議或推薦。請閱讀使用條款以了解更多資訊。