OPEN-SOURCE SCRIPT
[blackcat] L1 Rhythm Oscillator
OVERVIEW 📊💡
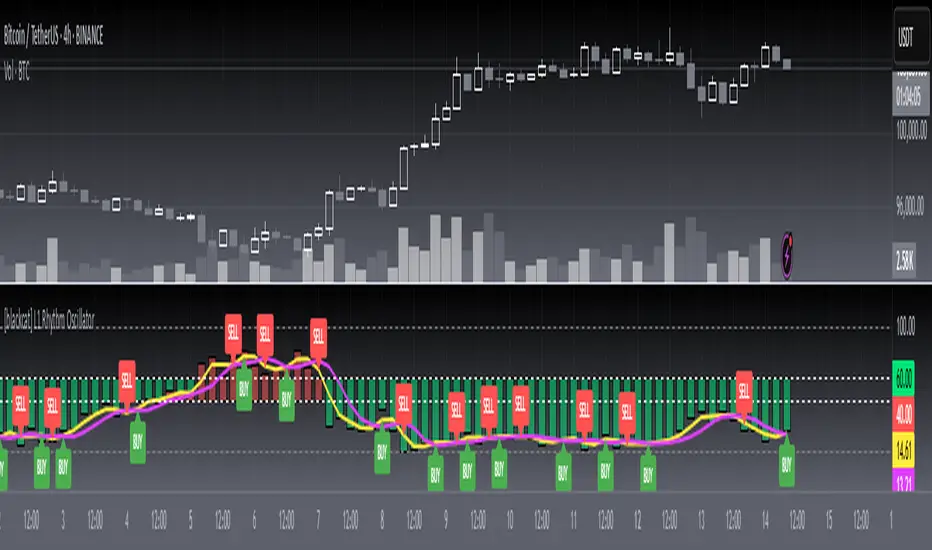
The [blackcat] L1 Rhythm Oscillator is an advanced oscillator designed to identify potential entry points in financial markets using a combination of Williams %R indicators and Time-Varying Moving Averages (TVMAs). This script provides traders with clear buy and sell signals that help them capitalize on trends while minimizing risk.
FEATURES 💡🌟
Williams %R Analysis:
Base Indicator (WR0): Measures overbought/oversold conditions within a specified period.
Smoothed Indicators (WR1 & WR2): Further refined versions of WR0 to filter out noise and highlight significant trends.
Dynamic Bands:
Bull Band: Shaded area between WR0 and the bullish threshold when WR0 falls below the defined level.
Bear Band: Shaded area between WR0 and the bearish threshold when WR0 exceeds the defined level.
Trading Signals:
Buy Signal: Generated when WR1 crosses above WR2, indicating a potential upward trend reversal.
Sell Signal: Triggered when WR1 crosses below WR2, suggesting a downward trend shift.
Thresholds:
Bull Threshold (default 60%): Marks levels where the asset is considered relatively undervalued.
Bear Threshold (default 40%): Indicates regions where the asset might be overvalued.
Visual Enhancements:
Colored Bands: Clearly distinguish between bullish and bearish areas.
Horizontal Lines: Provide quick reference points for overbought/oversold levels.
Labels: Display "BUY" and "SELL" markers at key signal locations.
HOW TO USE ⚙️📈
Add the Indicator to Your Chart:
Open your preferred asset's chart on TradingView.
Click on “Indicators” and search for “[blackcat] L1 Rhythm Oscillator.”
Add the indicator to your chart.
Customize Parameters:
Adjust these inputs according to your trading strategy:
WR Period: Sets the lookback window for calculating Williams %R.
Bull Threshold: Defines the upper limit for bullish territory.
Bear Threshold: Establishes the lower boundary for bearish territory.
TVMA Length: Controls the sensitivity of the moving average used in calculations.
Interpret Visual Elements:
Yellow Line (WR1): The first smoothed version of the base Williams %R.
Fuchsia Line (WR2): The second smoothed line derived from WR1 via TVMA.
Lime-Shaded Area: Represents Bull Band where prices are potentially undervalued.
Red-Shaded Area: Symbolizes Bear Band indicating possible overvaluation.
Horizontal Lines:
Value 0% represents perfect overbought condition.
Value 100% indicates extreme oversold state.
Bull/Bear thresholds provide additional context for interpreting market sentiment.
Act on Crossovers:
Look for instances where WR1 crosses through WR2:
When WR1 moves above WR2 → Potential BUY opportunity.
When WR1 dips below WR2 → Likely SELL scenario.
Consider Contextual Factors:
Combine the oscillator signals with other technical indicators like MACD, RSI, or volume analysis for more robust decision-making.
Be aware of broader market trends and news events that could impact price movements.
Manage Risk:
Always use proper stop-loss orders to protect against adverse price movements.
Consider position sizing based on available capital and risk tolerance.
LIMITATIONS ⚠️🔍
Historical Data Dependency: Like most oscillators, this tool relies on past data patterns which may not always predict future behavior accurately.
False Signals: No single indicator can guarantee correct predictions; false positives/negatives can arise during volatile periods.
Overfitting Risks: Customized settings might work well historically but fail under different market conditions without careful validation.
Complexity: Multiple layers of smoothing and crossover logic require understanding to interpret correctly.
NOTES 🔍📝
Parameter Optimization: Experiment with various combinations of WR Period, Bull/Bear Thresholds, and TVMA Length to find what works best for specific assets and timeframes.
Regular Review: Continuously monitor the performance of the indicator versus actual outcomes, adjusting parameters as needed.
Educational Resources: Deepen your knowledge about oscillator strategies, particularly focusing on how they detect reversals and momentum shifts.
Consistency Key: For successful implementation, maintain consistent rules regarding trade entries/exits regardless of short-term fluctuations.
開源腳本
秉持TradingView一貫精神,這個腳本的創作者將其設為開源,以便交易者檢視並驗證其功能。向作者致敬!您可以免費使用此腳本,但請注意,重新發佈代碼需遵守我們的社群規範。
Avoid losing contact!Don't miss out! The first and most important thing to do is to join my Discord chat now! Click here to start your adventure: discord.com/invite/ZTGpQJq 防止失联,请立即行动,加入本猫聊天群: discord.com/invite/ZTGpQJq
免責聲明
這些資訊和出版物並非旨在提供,也不構成TradingView提供或認可的任何形式的財務、投資、交易或其他類型的建議或推薦。請閱讀使用條款以了解更多資訊。