OPEN-SOURCE SCRIPT
EMA Reversal Point
EMA Reversal Point
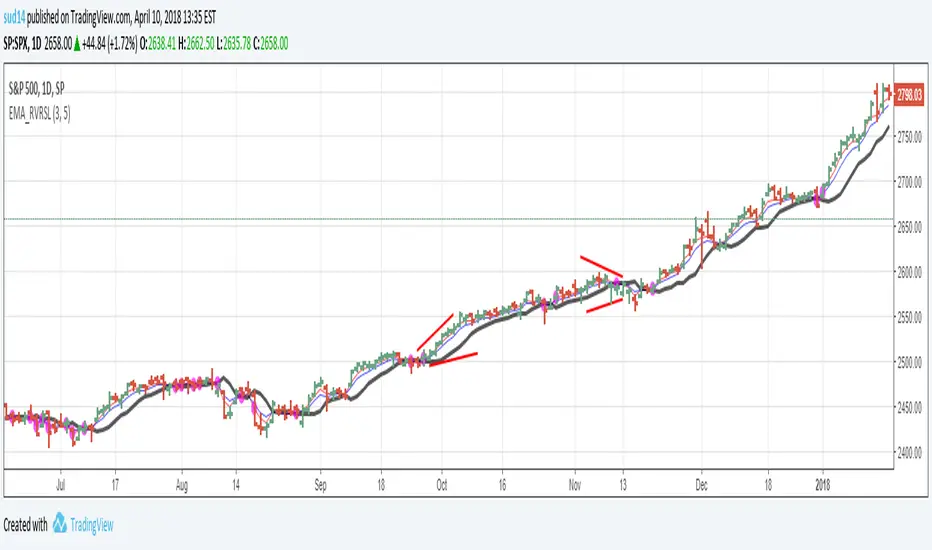
The script calculates the "likely" reversal point of 2 EMAs (3 and 5 for example) and plots as a line. The points there the EMA cross are highlighted with a Purple circle.
The way I use this indicator is by visually confirming that the reversal line is diverting away from price in case of strong trends.
Divergences between reversal line and price line are good entry points.
Wait for the price bar to clear the reversal line completely before initiating trades. (No overlaps!)
This is my first indicator script so please be kind on the comments!!
開源腳本
秉持TradingView一貫精神,這個腳本的創作者將其設為開源,以便交易者檢視並驗證其功能。向作者致敬!您可以免費使用此腳本,但請注意,重新發佈代碼需遵守我們的社群規範。
免責聲明
這些資訊和出版物並非旨在提供,也不構成TradingView提供或認可的任何形式的財務、投資、交易或其他類型的建議或推薦。請閱讀使用條款以了解更多資訊。
免責聲明
這些資訊和出版物並非旨在提供,也不構成TradingView提供或認可的任何形式的財務、投資、交易或其他類型的建議或推薦。請閱讀使用條款以了解更多資訊。