INVITE-ONLY SCRIPT
已更新 CF - KAMI KAMI EMA-HMA-VWMA SCALPER
This is your dark knight, your shining light in the crypto darkness... It's you and me against the machine..... rage, rage against the dying of the night!
This my greedy minions is the ticket..... the disruptive technology, the red pill, that breaks the Matrix.... get ready to join the revolution.
DESCRIPTION:
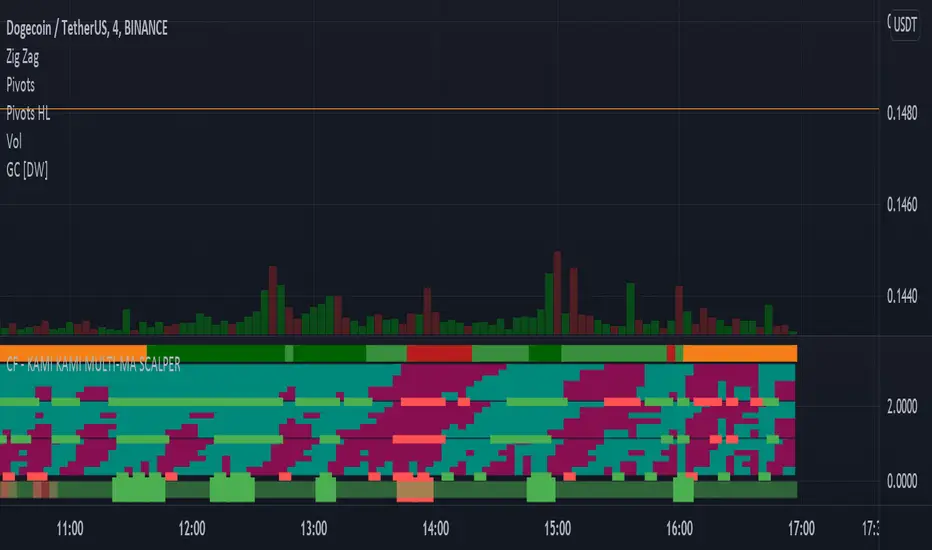
Lowest green/red line
The lowest alternating green red band is simply a general market indicator. It's EMA 50 over 200. This is a generally good indicator of current market conditions. If the band is red, you should favor taking short positions. If the band is green, long positions.
The three MA colored bands
This sophisticated indicator uses 3 central MA's in calculating its goodness. The HMA (Hull's Moving Average), at the bottom (of the three principal bands), is the most sensitive and responsive to immediate market conditions. It will generally give you the signal to enter or exit at the beginning of the price action move. But, this could also be a "false" signal - that doesn't continue in the expected direction.
The middle band is VWMA, volume-weighted moving average, and it is sensitive to volume - so it may turn green or red faster as volume increases or decreases. It gives somewhat similar signals to the top moving average which is the EMA or exponential moving average.
The GREEN RED signals
The signals below the bands which are true green and true red are "SUPER" signals which represent that all of the six small bands of each MA agree. These are very strong signals to enter and exit a position. If multiple SUPER signals agree this is even more confirmation.
SETTINGS
You can change the ema signals. They are currently optimized for scalping, but this indicator can work for larger timeframes.
I couldn't make this open-source as it represents a lot of work to get it to this point. If you are interested in this indicator and would like to have a custom version coded for your purposes, let me know.
This my greedy minions is the ticket..... the disruptive technology, the red pill, that breaks the Matrix.... get ready to join the revolution.
DESCRIPTION:
Lowest green/red line
The lowest alternating green red band is simply a general market indicator. It's EMA 50 over 200. This is a generally good indicator of current market conditions. If the band is red, you should favor taking short positions. If the band is green, long positions.
The three MA colored bands
This sophisticated indicator uses 3 central MA's in calculating its goodness. The HMA (Hull's Moving Average), at the bottom (of the three principal bands), is the most sensitive and responsive to immediate market conditions. It will generally give you the signal to enter or exit at the beginning of the price action move. But, this could also be a "false" signal - that doesn't continue in the expected direction.
The middle band is VWMA, volume-weighted moving average, and it is sensitive to volume - so it may turn green or red faster as volume increases or decreases. It gives somewhat similar signals to the top moving average which is the EMA or exponential moving average.
The GREEN RED signals
The signals below the bands which are true green and true red are "SUPER" signals which represent that all of the six small bands of each MA agree. These are very strong signals to enter and exit a position. If multiple SUPER signals agree this is even more confirmation.
SETTINGS
You can change the ema signals. They are currently optimized for scalping, but this indicator can work for larger timeframes.
I couldn't make this open-source as it represents a lot of work to get it to this point. If you are interested in this indicator and would like to have a custom version coded for your purposes, let me know.
發行說明
Updated the bands to be more readable. Now there is a SUPER-DUPER band below which is the strongest indicator (although may respond slightly late or early) to price action. This SUPER-DUPER signal represents perfect green or red across all 24 bands above. When a red appears inside the red band - and vice versa, this is the strongest signal. In addition, there is a universal "sensitivity" setting for each band which makes it work on different timescales. The larger numbers represent a longer, less sensitive, perspective (for longer trades)
發行說明
Labeled the bands and added the ADX to the mix on the top. Also changed the condition on the EMA filter to be when candles close ABOVE EMA 200. 僅限邀請腳本
只有經作者授權的使用者才能訪問此腳本,且通常需付費。您可以將此腳本加入收藏,但需先向作者申請並獲得許可後才能使用 — 點擊此處了解更多。如需更多詳情,請依照作者說明或直接聯繫cryptofilio。
除非您完全信任其作者並了解腳本的工作原理,否則TradingView不建議您付費或使用腳本。您也可以在我們的社群腳本中找到免費的開源替代方案。
作者的說明
You wish this was yours.
提醒:在請求訪問權限之前,請閱讀僅限邀請腳本指南。
免責聲明
這些資訊和出版物並不意味著也不構成TradingView提供或認可的金融、投資、交易或其他類型的意見或建議。請在使用條款閱讀更多資訊。
僅限邀請腳本
只有經作者授權的使用者才能訪問此腳本,且通常需付費。您可以將此腳本加入收藏,但需先向作者申請並獲得許可後才能使用 — 點擊此處了解更多。如需更多詳情,請依照作者說明或直接聯繫cryptofilio。
除非您完全信任其作者並了解腳本的工作原理,否則TradingView不建議您付費或使用腳本。您也可以在我們的社群腳本中找到免費的開源替代方案。
作者的說明
You wish this was yours.
提醒:在請求訪問權限之前,請閱讀僅限邀請腳本指南。
免責聲明
這些資訊和出版物並不意味著也不構成TradingView提供或認可的金融、投資、交易或其他類型的意見或建議。請在使用條款閱讀更多資訊。