INVITE-ONLY SCRIPT
Deribit Options
█ OVERVIEW
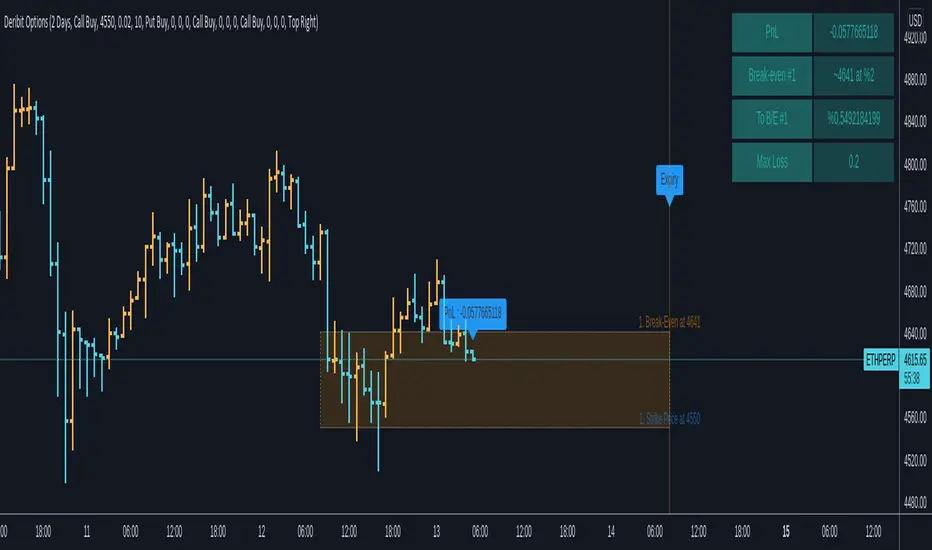
This script is designed to plot some essential option parameters in the chart, such as the expiry, your Break-even point and the strike price. Having these plotted on the chart can make your trading journey much more easier. It's always better to visualize the data/points on the chart than have it only as a foggy picture on your head. This script will also show tell the the distance from the current price to your Break-even, and the distance from Strike Price to break-even. All simple and easy to do on a piece of paper, but that for sure could take some time to plot correctly on the chart. The script will also show you an on-time PnL.
█ Future Plans and upgrades to this script may include :
1. Graphic chart to represent your PnL at every level.
2. Additional extra parameters
█ How to use :
1. Open the settings.
2. Select the period, then input your option details and you'll see it on the chart.
3. Activate the information box, to see some extra details.
Disclaimer : This script may contain errors as this is the first version. I would recommend double checking the results on a different tool before starting a trade.
僅限邀請腳本
只有經作者批准的使用者才能訪問此腳本。您需要申請並獲得使用權限。該權限通常在付款後授予。如欲了解更多詳情,請依照以下作者的說明操作,或直接聯絡NasserHumood。
除非您完全信任其作者並了解腳本的工作原理,否則TradingView不建議您付費或使用腳本。您也可以在我們的社群腳本中找到免費的開源替代方案。
作者的說明
Feel Free to contact me if you need access to this script, my information is down below.
提醒:在請求訪問權限之前,請閱讀僅限邀請腳本指南。
To get access to any of my indicators feel free to contact me here or on Twitter :
@Nasser_Humood
@Nasser_Humood
免責聲明
這些資訊和出版物並不意味著也不構成TradingView提供或認可的金融、投資、交易或其他類型的意見或建議。請在使用條款閱讀更多資訊。