OPEN-SOURCE SCRIPT
Vertical & Open Lines - Yearly [MsF]
Yearly Vertical & Open Lines Indicator [OAn]
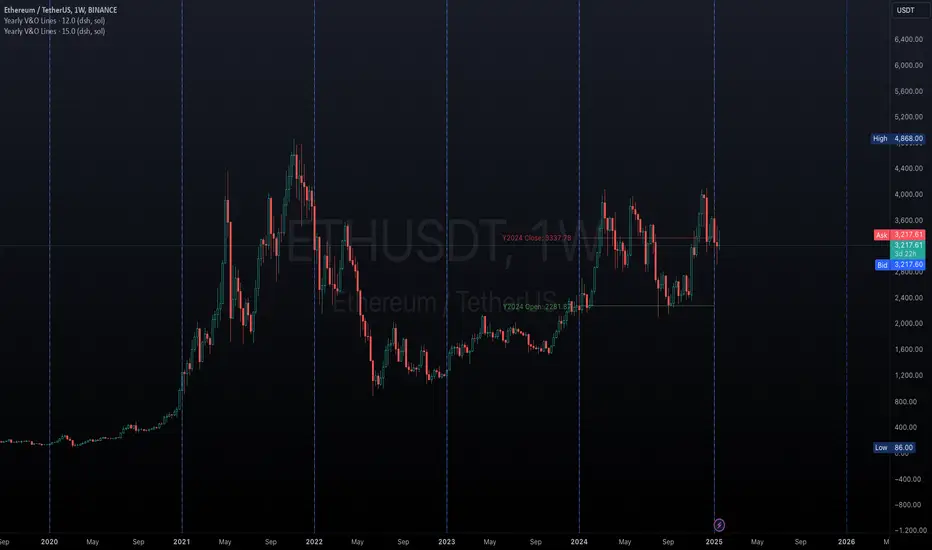
This indicator helps traders visualize yearly boundaries and track previous year's price levels. It draws:
- Vertical lines at the start of each year
- Horizontal lines showing previous year's open and close prices
- Optional labels with price information
Features:
- Customizable line colors and styles
- Toggle yearly vertical lines
- Show/hide previous year's price levels
- Optional price labels
- Next year line preview
Usage:
1. Add indicator to your chart
2. Adjust Base Time to match your market's yearly reset time
3. Customize colors and styles using input options
4. Toggle features as needed
開源腳本
本著TradingView的真正精神,此腳本的創建者將其開源,以便交易者可以查看和驗證其功能。向作者致敬!雖然您可以免費使用它,但請記住,重新發佈程式碼必須遵守我們的網站規則。
免責聲明
這些資訊和出版物並不意味著也不構成TradingView提供或認可的金融、投資、交易或其他類型的意見或建議。請在使用條款閱讀更多資訊。
開源腳本
本著TradingView的真正精神,此腳本的創建者將其開源,以便交易者可以查看和驗證其功能。向作者致敬!雖然您可以免費使用它,但請記住,重新發佈程式碼必須遵守我們的網站規則。
免責聲明
這些資訊和出版物並不意味著也不構成TradingView提供或認可的金融、投資、交易或其他類型的意見或建議。請在使用條款閱讀更多資訊。