OPEN-SOURCE SCRIPT
New York Master Range
📈 New York Master Range (5-Min Timeframe)
Description:
This custom TradingView indicator captures the opening range based on the body high and low of the first 3 candles after 10:30 AM (BRT – Brasília Time) on the 5-minute timeframe — a technique often used during the New York market session.
🔍 How it works:
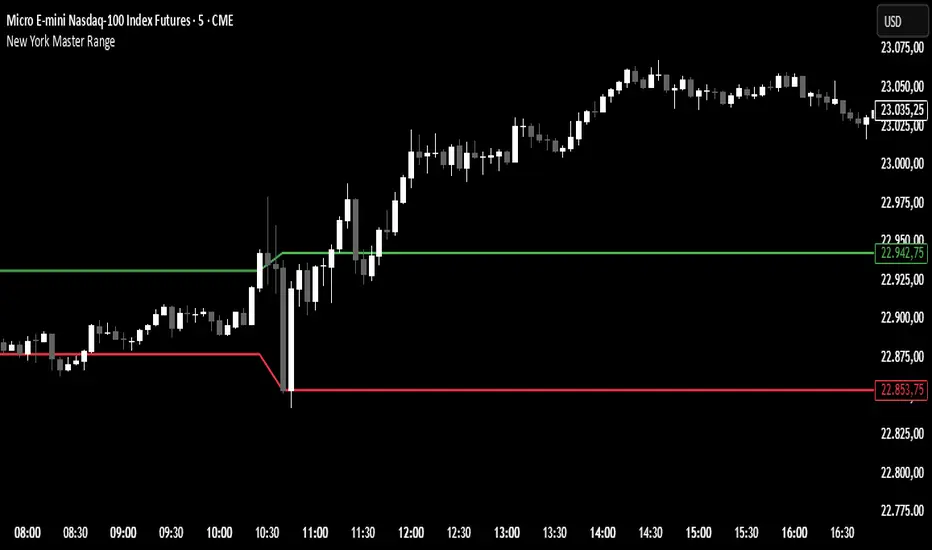
At exactly 10:30 AM (BRT), the indicator starts collecting the highs and lows of candle bodies (not wicks) for the next 3 five-minute candles.
Once the 3 candles are processed, the highest close/open (body high) and lowest close/open (body low) are plotted as static green and red lines on the chart.
These levels can act as key intraday support/resistance zones or range breakout triggers.
Description:
This custom TradingView indicator captures the opening range based on the body high and low of the first 3 candles after 10:30 AM (BRT – Brasília Time) on the 5-minute timeframe — a technique often used during the New York market session.
🔍 How it works:
At exactly 10:30 AM (BRT), the indicator starts collecting the highs and lows of candle bodies (not wicks) for the next 3 five-minute candles.
Once the 3 candles are processed, the highest close/open (body high) and lowest close/open (body low) are plotted as static green and red lines on the chart.
These levels can act as key intraday support/resistance zones or range breakout triggers.
開源腳本
秉持TradingView一貫精神,這個腳本的創作者將其設為開源,以便交易者檢視並驗證其功能。向作者致敬!您可以免費使用此腳本,但請注意,重新發佈代碼需遵守我們的社群規範。
免責聲明
這些資訊和出版物並非旨在提供,也不構成TradingView提供或認可的任何形式的財務、投資、交易或其他類型的建議或推薦。請閱讀使用條款以了解更多資訊。
開源腳本
秉持TradingView一貫精神,這個腳本的創作者將其設為開源,以便交易者檢視並驗證其功能。向作者致敬!您可以免費使用此腳本,但請注意,重新發佈代碼需遵守我們的社群規範。
免責聲明
這些資訊和出版物並非旨在提供,也不構成TradingView提供或認可的任何形式的財務、投資、交易或其他類型的建議或推薦。請閱讀使用條款以了解更多資訊。