OPEN-SOURCE SCRIPT
Stochastic Barcolor 2021-5-22
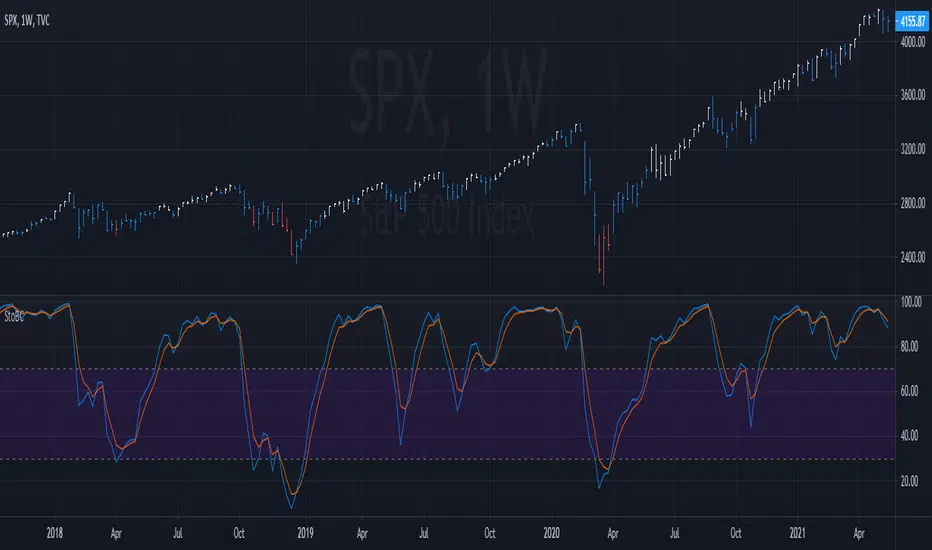
This one is the stochastic with barcolor added to it. In this example, the bars are white when the stochastic line is above is above both 70 AND its signal (vice-versa the bars are red). Adjust the lines and overbought/oversold levels however you see fit for your needs. On higher time frames, this can be used to spot the most bullish/bearish trends. On lower time frames it can be used to take profits. This setting is most effective when used on multiple time frames. Enjoy!
開源腳本
In true TradingView spirit, the creator of this script has made it open-source, so that traders can review and verify its functionality. Kudos to the author! While you can use it for free, remember that republishing the code is subject to our House Rules.
免責聲明
The information and publications are not meant to be, and do not constitute, financial, investment, trading, or other types of advice or recommendations supplied or endorsed by TradingView. Read more in the Terms of Use.