INVITE-ONLY SCRIPT
OG Take Off
This indicator is put in place to help you identify the 3 market phases.
Consolidation can be indicated by either dots or color coded candlesticks . You can use both. Consolidation zones are represented by the dotted lines.
A green arrow indicates a buy signal. A red arrow indicates a sell signal.
Theme allows you to change the color of the background to whatever you like.
To change the color of the moving average, you must uncheck "Modern Theme Trend MA Color" under 'Style'.
When price is above 50 moving average on the higher timeframe and the color of the candle is green on the higher time frame, you are in a long market. When price is below the 50 moving average and the color of the candle is red on the higher timeframe, you are in a short market.
Trend puts a trend cloud on the chart. When green and above the 50 moving average, you can assume the market is long. Look for buys on the smaller time frame. When red and below the 50 moving average, you can assume the market is short on the smaller time frame. You can also draw an average price line through the middle of the consolidation box to tell you the directional bias.
The moving average is set to 50 by default but can be changed. You can also add 2 more moving averages to the chart. (Options: SMA , EMA , SWMA , WMA , VWMA , HMA )
Consolidation on the inputs page allows you to see when the market is consolidating with dots and color change of the candlesticks . Opacity of the dots can be changed under 'Style' (Upper Band Dots/Lower Band Dots) You can assume when the dots are below the candlestick , price is buying; when the dots ae above the candlesticks , price is selling.
't' and 'b' represent tops and bottoms and can help you recognize finding the top and bottom on the daily when doing top down analysis. It can also help you recognize double tops, double bottoms, triple tops, etc.
This indicator is best used on the 1 hr or 4 hr time frame. If you zoom out on the chart, you can notice when the market is consolidating, when the market is in expansion phase, and when the market is trending. When the market is in expansion phase, you may see a lot of 'swing low/swing high' action. When the market is trending, it takes off and doesn't look back.
If you enter on the 5 min and ride the 1 hr trend, that is a great idea. If you enter on the 15 min and ride the 4 hr trend, that is an even better idea.
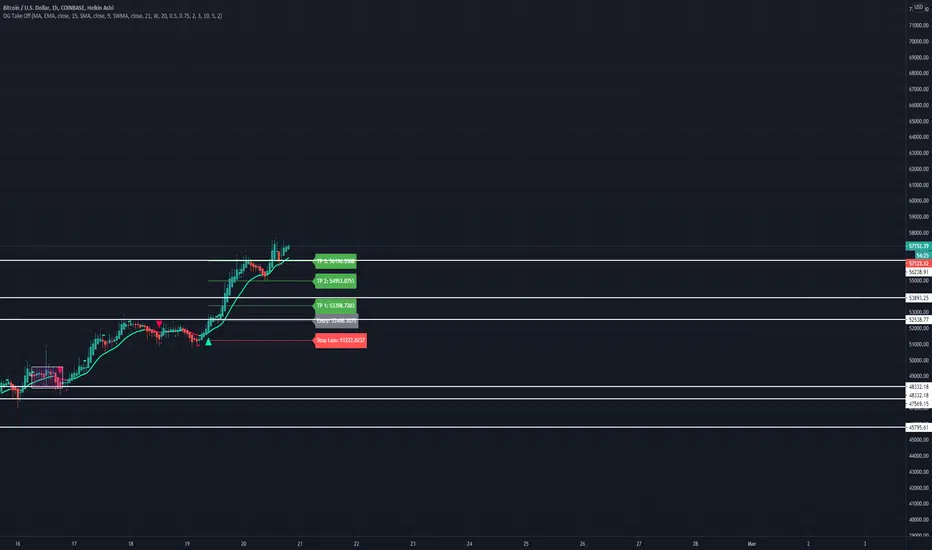
The TP levels can be changed according to your risk reward ratio.
Consolidation can be indicated by either dots or color coded candlesticks . You can use both. Consolidation zones are represented by the dotted lines.
A green arrow indicates a buy signal. A red arrow indicates a sell signal.
Theme allows you to change the color of the background to whatever you like.
To change the color of the moving average, you must uncheck "Modern Theme Trend MA Color" under 'Style'.
When price is above 50 moving average on the higher timeframe and the color of the candle is green on the higher time frame, you are in a long market. When price is below the 50 moving average and the color of the candle is red on the higher timeframe, you are in a short market.
Trend puts a trend cloud on the chart. When green and above the 50 moving average, you can assume the market is long. Look for buys on the smaller time frame. When red and below the 50 moving average, you can assume the market is short on the smaller time frame. You can also draw an average price line through the middle of the consolidation box to tell you the directional bias.
The moving average is set to 50 by default but can be changed. You can also add 2 more moving averages to the chart. (Options: SMA , EMA , SWMA , WMA , VWMA , HMA )
Consolidation on the inputs page allows you to see when the market is consolidating with dots and color change of the candlesticks . Opacity of the dots can be changed under 'Style' (Upper Band Dots/Lower Band Dots) You can assume when the dots are below the candlestick , price is buying; when the dots ae above the candlesticks , price is selling.
't' and 'b' represent tops and bottoms and can help you recognize finding the top and bottom on the daily when doing top down analysis. It can also help you recognize double tops, double bottoms, triple tops, etc.
This indicator is best used on the 1 hr or 4 hr time frame. If you zoom out on the chart, you can notice when the market is consolidating, when the market is in expansion phase, and when the market is trending. When the market is in expansion phase, you may see a lot of 'swing low/swing high' action. When the market is trending, it takes off and doesn't look back.
If you enter on the 5 min and ride the 1 hr trend, that is a great idea. If you enter on the 15 min and ride the 4 hr trend, that is an even better idea.
The TP levels can be changed according to your risk reward ratio.
僅限邀請腳本
僅作者批准的使用者才能訪問此腳本。您需要申請並獲得使用許可,通常需在付款後才能取得。更多詳情,請依照作者以下的指示操作,或直接聯絡BeeAstronaut。
TradingView不建議在未完全信任作者並了解其運作方式的情況下購買或使用腳本。您也可以在我們的社群腳本中找到免費的開源替代方案。
作者的說明
Please email support@theoriginalppl.com for access.
免責聲明
這些資訊和出版物並非旨在提供,也不構成TradingView提供或認可的任何形式的財務、投資、交易或其他類型的建議或推薦。請閱讀使用條款以了解更多資訊。
僅限邀請腳本
僅作者批准的使用者才能訪問此腳本。您需要申請並獲得使用許可,通常需在付款後才能取得。更多詳情,請依照作者以下的指示操作,或直接聯絡BeeAstronaut。
TradingView不建議在未完全信任作者並了解其運作方式的情況下購買或使用腳本。您也可以在我們的社群腳本中找到免費的開源替代方案。
作者的說明
Please email support@theoriginalppl.com for access.
免責聲明
這些資訊和出版物並非旨在提供,也不構成TradingView提供或認可的任何形式的財務、投資、交易或其他類型的建議或推薦。請閱讀使用條款以了解更多資訊。