INVITE-ONLY SCRIPT
The Zone Seeker Supply and Demand - by Karoshi Trading
The Zone Seeker Supply and Demand - by Karoshi Trading
The Zone Seeker is based on the Supply & Demand Methodology.
Activating this indicator will mark all the zones of your chart.
Depending on your setting preferences, some zones will be showed or not.
The indicator code works as follow:
We will use the number of consecutive candles, body size compared to the wick and body length to calculate the zones.
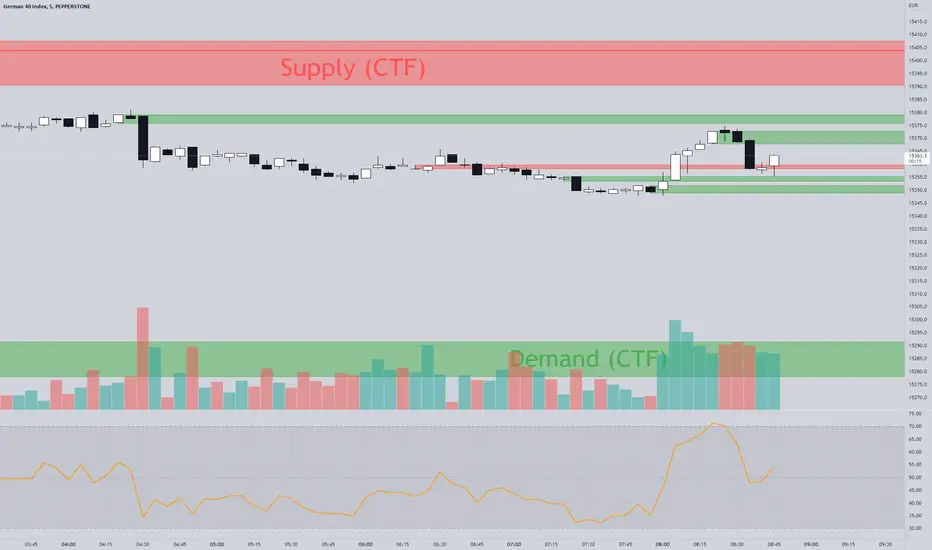
Here is an example of the indicator.
1# Consecutive Candles
The indicator will search for minimum 2 consecutive candles of the same color. That means, that both candles has to close above the opening price of each candle (Bullish) or close below there opening prices (Bearish).
2# Body Size
After the first condition is met, the Code will now look into each candles of step #1.
Each of the candles should be equal or above 50% body, to meet the second requirement.
It will calculate the body size, compared to the full candle size to determine the percentage of the body itself.
3# Body Length
If the first two steps are positive, the code will jump into the 3rd phase of the indicator, the „Body Length“. With 2 options (ATR & MA) the code will calculate within a 14 candles period the average range of the candles. With that information, the code will now compare the average range to our candles from step #1.
The candles from step #1 has to be equal or bigger than 1.5 times the range/size of the average candle to met our last requirement.
4# Demand & Supply Zones
After all 3 requirements are met, the code will search for the last candle of the opposite color, to mark a zone. As example, if we have a demand zone with all conditions met, the indicator will search for the latest candle where the price closed below the opening price.
After finding such a candle, the indicator will mark the whole range of this candle (body + wick) and create a colored rectangle with a description in it. As example „Demand CTF“
CTF = Current Time Frame

5# Testing the Zones
As a test, we only count if the price went inside or touched the zone and left it and closed outside the zone. (You can choose by yourself if touched is on or off in the settings).
The code will not count each candle as a test, but each phase where the price went into the zone and closed outside the zone. As an example, if price went into a demand zone and closes 2 candles within the zone and the 3rd candle closes above the demand zone, that will count as one test.
Each test, will change the color of the zone, to keep in track of the freshness of the zones. After the 3rd test of a zone, the zone will be automatically deleted.
6# Flipping Zones
As a flipping zone is meant, that if the demand zone get broken to the downside by 2 or less candles it will automatically turn into a fresh supply zone. Important to know is, it will only occur if the candles closes below the demand zone. Same occurs for supply zones.

7# Multiple TimeFrames
It is possible, to choose one more time frame on top of the current time frame your are actually trading.
The code will separate both time frames, so you can choose how many zones you want to see in each time frame.
The supplementary time frame zones will be in 3 different grey colors, to destinguish the zones.
Also, overlapping zones will have a little info box, to avoid overlapping text.
On top of that, you can also show "all" time frames at once.
Current Time Frame = Colorized Zones
Supplementary Time Frames = Grey Zones

The Zone Seeker is based on the Supply & Demand Methodology.
Activating this indicator will mark all the zones of your chart.
Depending on your setting preferences, some zones will be showed or not.
The indicator code works as follow:
We will use the number of consecutive candles, body size compared to the wick and body length to calculate the zones.
Here is an example of the indicator.
1# Consecutive Candles
The indicator will search for minimum 2 consecutive candles of the same color. That means, that both candles has to close above the opening price of each candle (Bullish) or close below there opening prices (Bearish).
2# Body Size
After the first condition is met, the Code will now look into each candles of step #1.
Each of the candles should be equal or above 50% body, to meet the second requirement.
It will calculate the body size, compared to the full candle size to determine the percentage of the body itself.
3# Body Length
If the first two steps are positive, the code will jump into the 3rd phase of the indicator, the „Body Length“. With 2 options (ATR & MA) the code will calculate within a 14 candles period the average range of the candles. With that information, the code will now compare the average range to our candles from step #1.
The candles from step #1 has to be equal or bigger than 1.5 times the range/size of the average candle to met our last requirement.
4# Demand & Supply Zones
After all 3 requirements are met, the code will search for the last candle of the opposite color, to mark a zone. As example, if we have a demand zone with all conditions met, the indicator will search for the latest candle where the price closed below the opening price.
After finding such a candle, the indicator will mark the whole range of this candle (body + wick) and create a colored rectangle with a description in it. As example „Demand CTF“
CTF = Current Time Frame
5# Testing the Zones
As a test, we only count if the price went inside or touched the zone and left it and closed outside the zone. (You can choose by yourself if touched is on or off in the settings).
The code will not count each candle as a test, but each phase where the price went into the zone and closed outside the zone. As an example, if price went into a demand zone and closes 2 candles within the zone and the 3rd candle closes above the demand zone, that will count as one test.
Each test, will change the color of the zone, to keep in track of the freshness of the zones. After the 3rd test of a zone, the zone will be automatically deleted.
6# Flipping Zones
As a flipping zone is meant, that if the demand zone get broken to the downside by 2 or less candles it will automatically turn into a fresh supply zone. Important to know is, it will only occur if the candles closes below the demand zone. Same occurs for supply zones.
7# Multiple TimeFrames
It is possible, to choose one more time frame on top of the current time frame your are actually trading.
The code will separate both time frames, so you can choose how many zones you want to see in each time frame.
The supplementary time frame zones will be in 3 different grey colors, to destinguish the zones.
Also, overlapping zones will have a little info box, to avoid overlapping text.
On top of that, you can also show "all" time frames at once.
Current Time Frame = Colorized Zones
Supplementary Time Frames = Grey Zones
僅限邀請腳本
僅作者批准的使用者才能訪問此腳本。您需要申請並獲得使用許可,通常需在付款後才能取得。更多詳情,請依照作者以下的指示操作,或直接聯絡Karoshi-Trading。
TradingView不建議在未完全信任作者並了解其運作方式的情況下購買或使用腳本。您也可以在我們的社群腳本中找到免費的開源替代方案。
作者的說明
If you want access to the indicator, please send me a message or ask for access in the comment field.
Optionally send me a mail:
contact@karoshi-trading.com
免責聲明
這些資訊和出版物並非旨在提供,也不構成TradingView提供或認可的任何形式的財務、投資、交易或其他類型的建議或推薦。請閱讀使用條款以了解更多資訊。