INVITE-ONLY SCRIPT
已更新 ICT Smart Money Liquidity Levels
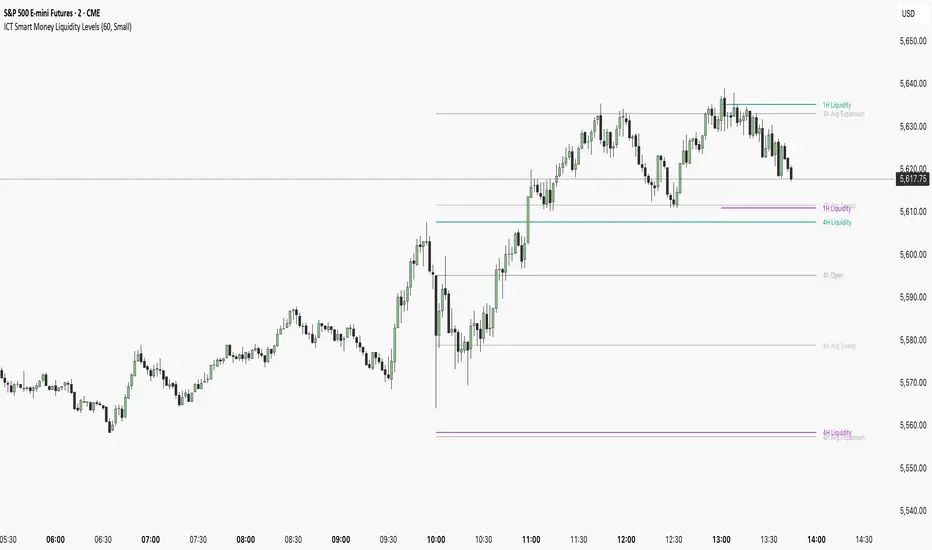
The ICT Smart Money Liquidity Levels indicator is designed to visualize key liquidity areas across multiple timeframes. Based on ICT concepts, this tool can help traders analyze price movement, liquidity sweeps, and expansion levels without switching between timeframes.
This indicator highlights liquidity levels at significant highs and lows, allowing users to track potential areas of interest where price may react. By also incorporating historical measurements, it also provides forecasted average sweep and expansion zones.
Features:
- Liquidity Levels
Plots previous HTF candle highs and lows. Available for 1H, 4H, Daily.
- Major Liquidity Levels
Highlights areas where price previously reached a significant high or low within 10 HTF candles. Available for 1H, 4H, Daily.
- Sweep and Expansion Forecast
Uses historical price data to forecast the average sweep and expansion levels for the next HTF candle. Available for 4H, Daily, Weekly, Monthly.


Why Is This Indicator Useful?
Based on ICT concepts, price seeks liquidity, often targeting trapped stops above highs and below lows before reversing or continuing its trend. High-timeframe (HTF) highs and lows, such as 1H, 4H, and Daily liquidity levels, act as natural draw points where price is likely to react. These levels represent areas where stop hunts, liquidity grabs, and institutional order flow often take place. By marking these zones, traders can anticipate where price may seek liquidity before making a significant move.
Additionally, historical liquidity sweeps and expansion zones provide insight into how price has behaved in similar situations in the past. According to ICT methodology, price often manipulates liquidity before expanding in the intended direction. By tracking average sweep and expansion levels, traders can forecast potential price movement, aligning their entries with areas where liquidity has historically been taken or distributed.
Disclaimer:
This indicator is for informational and educational purposes only. It does not provide financial, investment, or trading advice. No guarantees are made regarding accuracy, completeness, or profitability. Trading involves risk, and past performance does not indicate future results. Users are solely responsible for their trading decisions. By using this indicator, you acknowledge that the creator is not liable for any financial losses or decisions based on the information provided.
More Examples:


This indicator highlights liquidity levels at significant highs and lows, allowing users to track potential areas of interest where price may react. By also incorporating historical measurements, it also provides forecasted average sweep and expansion zones.
Features:
- Liquidity Levels
Plots previous HTF candle highs and lows. Available for 1H, 4H, Daily.
- Major Liquidity Levels
Highlights areas where price previously reached a significant high or low within 10 HTF candles. Available for 1H, 4H, Daily.
- Sweep and Expansion Forecast
Uses historical price data to forecast the average sweep and expansion levels for the next HTF candle. Available for 4H, Daily, Weekly, Monthly.
Why Is This Indicator Useful?
Based on ICT concepts, price seeks liquidity, often targeting trapped stops above highs and below lows before reversing or continuing its trend. High-timeframe (HTF) highs and lows, such as 1H, 4H, and Daily liquidity levels, act as natural draw points where price is likely to react. These levels represent areas where stop hunts, liquidity grabs, and institutional order flow often take place. By marking these zones, traders can anticipate where price may seek liquidity before making a significant move.
Additionally, historical liquidity sweeps and expansion zones provide insight into how price has behaved in similar situations in the past. According to ICT methodology, price often manipulates liquidity before expanding in the intended direction. By tracking average sweep and expansion levels, traders can forecast potential price movement, aligning their entries with areas where liquidity has historically been taken or distributed.
Disclaimer:
This indicator is for informational and educational purposes only. It does not provide financial, investment, or trading advice. No guarantees are made regarding accuracy, completeness, or profitability. Trading involves risk, and past performance does not indicate future results. Users are solely responsible for their trading decisions. By using this indicator, you acknowledge that the creator is not liable for any financial losses or decisions based on the information provided.
More Examples:
發行說明
Added 15m and 30m Liquidity Levels.僅限邀請腳本
只有經作者批准的使用者才能訪問此腳本。您需要申請並獲得使用權限。該權限通常在付款後授予。如欲了解更多詳情,請依照以下作者的說明操作,或直接聯絡dekatrades。
除非您完全信任其作者並了解腳本的工作原理,否則TradingView不建議您付費或使用腳本。您也可以在我們的社群腳本中找到免費的開源替代方案。
作者的說明
To get access to this indicator, visit https://dekatrades.com
免責聲明
這些資訊和出版物並不意味著也不構成TradingView提供或認可的金融、投資、交易或其他類型的意見或建議。請在使用條款閱讀更多資訊。
僅限邀請腳本
只有經作者批准的使用者才能訪問此腳本。您需要申請並獲得使用權限。該權限通常在付款後授予。如欲了解更多詳情,請依照以下作者的說明操作,或直接聯絡dekatrades。
除非您完全信任其作者並了解腳本的工作原理,否則TradingView不建議您付費或使用腳本。您也可以在我們的社群腳本中找到免費的開源替代方案。
作者的說明
To get access to this indicator, visit https://dekatrades.com
免責聲明
這些資訊和出版物並不意味著也不構成TradingView提供或認可的金融、投資、交易或其他類型的意見或建議。請在使用條款閱讀更多資訊。