OPEN-SOURCE SCRIPT
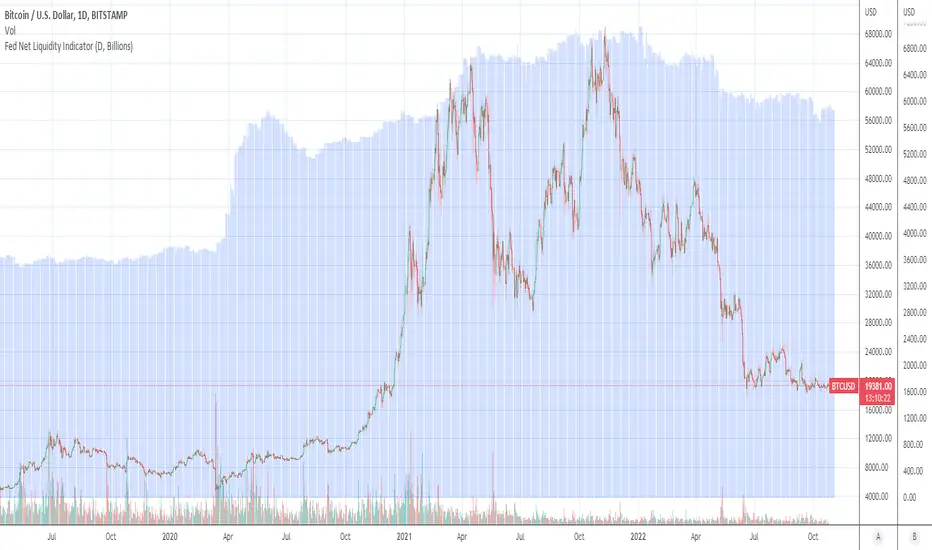
Fed Net Liquidity Indicator (24-Oct-2022 update)

This indicator is an implementation of the USD Liquidity Index originally proposed by Arthur Hayes based on the initial implementation of jlb05013, kudos to him!
I have incorporated subsequent additions (Standing Repo Facility and Central Bank Liquidity Swaps lines) and dealt with some recent changes in reporting units from TradingView.
This is a macro indicator that aims at tracking how much USD liquidity is available to chase financial assets:
- When the FED is expanding liquidity, financial asset prices tend to increase
- When the FED is contracting liquidity, financial asset prices tend to decrease
Here is the current calculation:
Net Liquidity =
(+) The Fed’s Balance Sheet (FRED:WALCL)
(-) NY Fed Total Amount of Accepted Reverse Repo Bids (FRED:RRPONTTLD)
(-) US Treasury General Account Balance Held at NY Fed (FRED:WTREGEN)
(+) NY Fed - Standing Repo Facility (FRED:RPONTSYD)
(+) NY Fed - Central Bank Liquidity Swaps (FRED:SWPT)
開源腳本
秉持TradingView一貫精神,這個腳本的創作者將其設為開源,以便交易者檢視並驗證其功能。向作者致敬!您可以免費使用此腳本,但請注意,重新發佈代碼需遵守我們的社群規範。
免責聲明
這些資訊和出版物並非旨在提供,也不構成TradingView提供或認可的任何形式的財務、投資、交易或其他類型的建議或推薦。請閱讀使用條款以了解更多資訊。
開源腳本
秉持TradingView一貫精神,這個腳本的創作者將其設為開源,以便交易者檢視並驗證其功能。向作者致敬!您可以免費使用此腳本,但請注意,重新發佈代碼需遵守我們的社群規範。
免責聲明
這些資訊和出版物並非旨在提供,也不構成TradingView提供或認可的任何形式的財務、投資、交易或其他類型的建議或推薦。請閱讀使用條款以了解更多資訊。