PROTECTED SOURCE SCRIPT
Daily FVG H/L with Sweep Removal
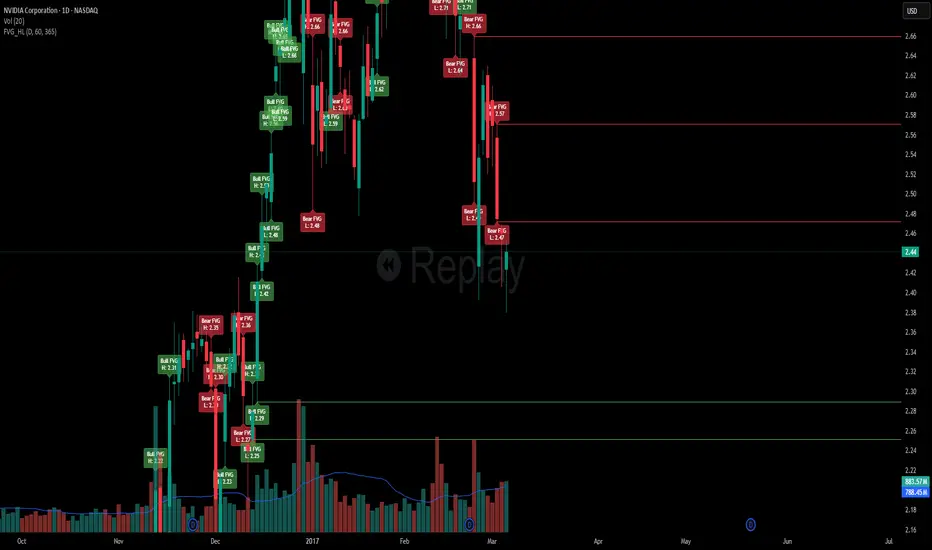
This indicator marks swing highs or lows of the daily candles from which the fair value gaps were created.
It gives you insight to crucial prices such as the highs and lows by this indicator and whether they have been swept or not.
The first reaction of the high or low will be counted as a sweep.
Once we run the high or low created by the reaction, then the indicator will mark that as a used high or low and will get rid of the line drawn to mark the high/low.
This can be used to watch important levels being swept which can sometimes indicate potential reversals on lower time frames.
Note: this indicator does not give you 100% accurate results or reliability and it requires you to conduct further research on the markets to create a reliable strategy.
This indicator may be of benefit if merged with other technical indicators or can support your technical strategies.
受保護腳本
此腳本以閉源形式發佈。 不過,您可以自由使用,沒有任何限制 — 點擊此處了解更多。
免責聲明
這些資訊和出版物並非旨在提供,也不構成TradingView提供或認可的任何形式的財務、投資、交易或其他類型的建議或推薦。請閱讀使用條款以了解更多資訊。
免責聲明
這些資訊和出版物並非旨在提供,也不構成TradingView提供或認可的任何形式的財務、投資、交易或其他類型的建議或推薦。請閱讀使用條款以了解更多資訊。