PROTECTED SOURCE SCRIPT
已更新 Bollinger Bands 3 to 5 Pull-back Detektor Test version
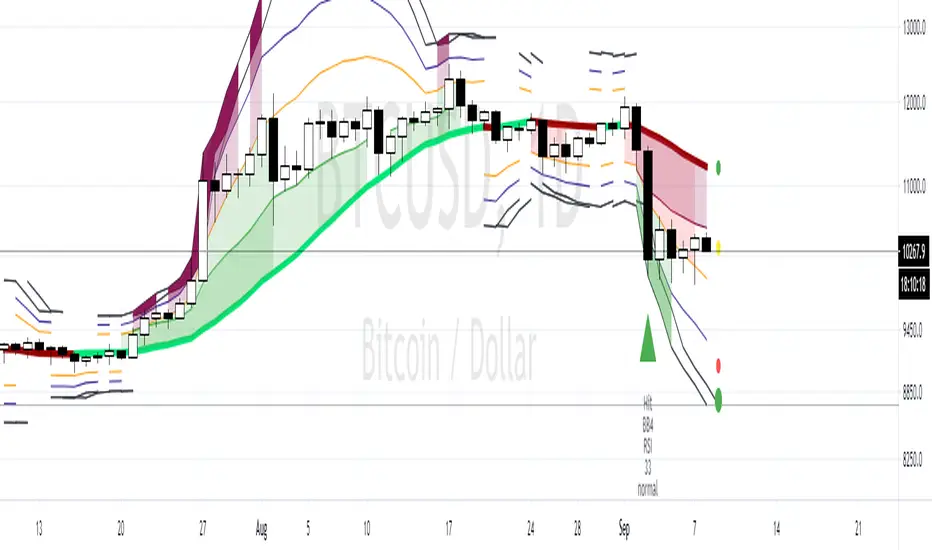
We use a mix Bollinger and Keltner.
The price always want to stay inside the Bollinger.
A lot of times we have big candels with great pullbacks.
If u are long and the Indicator show a red BB Area there is a god chance for a pullback.
We have rsi label and Rsi extreme label
If the rsi is High or extreme High u see it in the chart an u can look for a divergence that may end the trend.
I want to use it for scalping together with Pivot Point standart. It is not testet. Please use Papertrading first.
 A small Video (german)
If u try it plase leave a commend.
Have fun
The price always want to stay inside the Bollinger.
A lot of times we have big candels with great pullbacks.
If u are long and the Indicator show a red BB Area there is a god chance for a pullback.
We have rsi label and Rsi extreme label
If the rsi is High or extreme High u see it in the chart an u can look for a divergence that may end the trend.
I want to use it for scalping together with Pivot Point standart. It is not testet. Please use Papertrading first.
If u try it plase leave a commend.
Have fun
發行說明
added offset bollinger
it is easier to see good pullback entrys or good points to leave a trade.
This indicator is only for quick and dirty trades. We see a lot of strong Candels in Crypto in some seconds or minutes 3-4-5% Pullbacks follow.
In higer timeframes u can use it to find good exit points
have fun
發行說明
sma dots 50-100-200 daily wekly monthly and actual Timframe added發行說明
a lot of simple code changes ris lenth fixed
alert condition added.
發行說明
default options changed發行說明
inputs cleaned發行說明
some small code changes發行說明
Small ma bugfix發行說明
clean up small changes發行說明
small code update受保護腳本
此腳本以閉源形式發佈。 不過,您可以自由使用,沒有任何限制 — 點擊此處了解更多。
Du willst kostenlos TA lernen?
Du hast fragen zu einem Chart?
Mich findet man auch hier.
t.me/BitCoin_AltCoin_Chart_Chat
twitter.com/Mr_JB_BitCoin
Trainer für Technische Analyse
Du hast fragen zu einem Chart?
Mich findet man auch hier.
t.me/BitCoin_AltCoin_Chart_Chat
twitter.com/Mr_JB_BitCoin
Trainer für Technische Analyse
免責聲明
這些資訊和出版物並非旨在提供,也不構成TradingView提供或認可的任何形式的財務、投資、交易或其他類型的建議或推薦。請閱讀使用條款以了解更多資訊。
受保護腳本
此腳本以閉源形式發佈。 不過,您可以自由使用,沒有任何限制 — 點擊此處了解更多。
Du willst kostenlos TA lernen?
Du hast fragen zu einem Chart?
Mich findet man auch hier.
t.me/BitCoin_AltCoin_Chart_Chat
twitter.com/Mr_JB_BitCoin
Trainer für Technische Analyse
Du hast fragen zu einem Chart?
Mich findet man auch hier.
t.me/BitCoin_AltCoin_Chart_Chat
twitter.com/Mr_JB_BitCoin
Trainer für Technische Analyse
免責聲明
這些資訊和出版物並非旨在提供,也不構成TradingView提供或認可的任何形式的財務、投資、交易或其他類型的建議或推薦。請閱讀使用條款以了解更多資訊。