OPEN-SOURCE SCRIPT
RSI - Made Easy
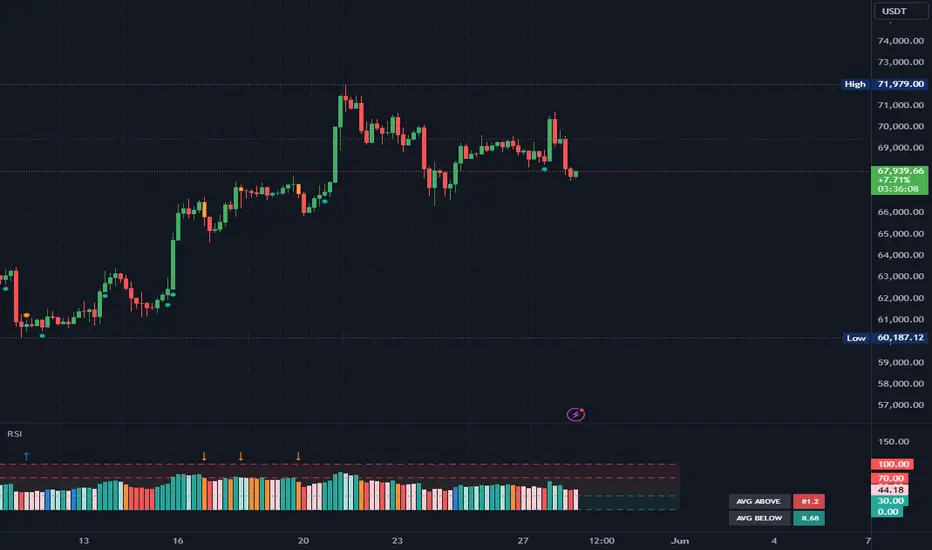
This indicator is a visually improved version of RSI. It makes it much easier to see what's happening by simplifying those confusing, intersecting lines. With this, you can detect the RSI direction more clearly. All the features are also explained in the tooltips of the input fields. Some extra features are included, such as average top and bottom calculation, standard deviation and divergences.
Color legend:
Color legend:
- Green: RSI Above MA and Rising
- Light Green: RSI Above MA and Falling
- Red: RSI Below MA and Falling
- Light Red: RSI Below MA and Rising
- Blue: RSI Crossover MA
- Orange: RSI Crossunder MA
- Blue Arrow: Bullish Divergence
- Orange Arrow: Bearish Divergence
開源腳本
秉持TradingView一貫精神,這個腳本的創作者將其設為開源,以便交易者檢視並驗證其功能。向作者致敬!您可以免費使用此腳本,但請注意,重新發佈代碼需遵守我們的社群規範。
免責聲明
這些資訊和出版物並非旨在提供,也不構成TradingView提供或認可的任何形式的財務、投資、交易或其他類型的建議或推薦。請閱讀使用條款以了解更多資訊。
免責聲明
這些資訊和出版物並非旨在提供,也不構成TradingView提供或認可的任何形式的財務、投資、交易或其他類型的建議或推薦。請閱讀使用條款以了解更多資訊。