INVITE-ONLY SCRIPT
مؤشر الحوت الأول
✅ History (Signals)
• Most prominent buy/sell signals (Buy/Sell).
• Smart buy/sell signals (Smart Buy/Sell) are compatible with price alignment with the trend and EMA.
• Reversal indicators (Reversal signals) when the market is overbought/oversold.
• Channel breakouts signals when strong price levels are broken.
⸻
✅ Errors (Trend)
• Average trend bar: A multi-colored set with a custom background color.
• Trend Cloud: A cloud between the EMA150 and EMA250 that gives you the strength of the error (bullish/bearish).
• Chaos trend line: A moving ATR line (like a trailing stop) to confirm the error.
• EMA200: A solid line for general correction.
⸻
✅ Colors and Candlestick Reading
• Candlesticks are colored according to the Relative Strength Index (RSI) or the trend.
• Different colors indicate buying or selling strength (low RSI → red, high RSI →).
⸻
✅ Relative Strength Index + Oversold Zones
• Cap chart based on the Relative Strength Index (RSI):
• Green = Light overbought.
• Red = Light oversold.
• Measures oversold conditions and integrates with Facebook to confirm entry/exit.
⸻
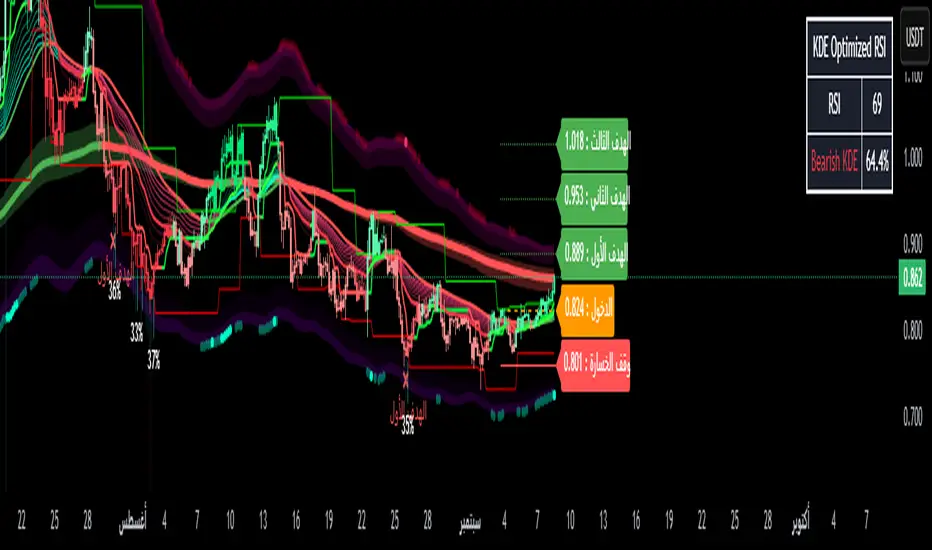
✅ Dashboard
Located below the chart and displays:
• Volatility (weak, very strong, etc.).
• Current RSI value.
• Over the same timeframe (3-minute, 5-minute, 15-minute, 1-hour, 4-hour, daily, etc.).
⸻
✅ Multiple Management (Risk Management)
• Entry – Stop Loss – Stop Loss zones (TP1, TP2, TP3) are found directly on the chart.
• Draws lines and labels at entry, stop, and target levels.
• This feature can be enabled or disabled in the settings.
⸻
✅ Additional Tools
• Order Blocks (off by default in the code).
• Keltner Channels are cloud-like compression/divergence zones.
• Volatility Filter: Measures ATR and Elastic Divergence to give you the strength of the movement.
⸻
📊 In short:
Your indicator isn't just one; it's a complete suite of tools:
• Smart Buy/Sell Signals +
• Trend and Cloud + EMA200
• Reversal and Saturation Signals
• Dashboard for Multi-Timeframe Analysis
• Capital Management with Targets and Stops
• Most prominent buy/sell signals (Buy/Sell).
• Smart buy/sell signals (Smart Buy/Sell) are compatible with price alignment with the trend and EMA.
• Reversal indicators (Reversal signals) when the market is overbought/oversold.
• Channel breakouts signals when strong price levels are broken.
⸻
✅ Errors (Trend)
• Average trend bar: A multi-colored set with a custom background color.
• Trend Cloud: A cloud between the EMA150 and EMA250 that gives you the strength of the error (bullish/bearish).
• Chaos trend line: A moving ATR line (like a trailing stop) to confirm the error.
• EMA200: A solid line for general correction.
⸻
✅ Colors and Candlestick Reading
• Candlesticks are colored according to the Relative Strength Index (RSI) or the trend.
• Different colors indicate buying or selling strength (low RSI → red, high RSI →).
⸻
✅ Relative Strength Index + Oversold Zones
• Cap chart based on the Relative Strength Index (RSI):
• Green = Light overbought.
• Red = Light oversold.
• Measures oversold conditions and integrates with Facebook to confirm entry/exit.
⸻
✅ Dashboard
Located below the chart and displays:
• Volatility (weak, very strong, etc.).
• Current RSI value.
• Over the same timeframe (3-minute, 5-minute, 15-minute, 1-hour, 4-hour, daily, etc.).
⸻
✅ Multiple Management (Risk Management)
• Entry – Stop Loss – Stop Loss zones (TP1, TP2, TP3) are found directly on the chart.
• Draws lines and labels at entry, stop, and target levels.
• This feature can be enabled or disabled in the settings.
⸻
✅ Additional Tools
• Order Blocks (off by default in the code).
• Keltner Channels are cloud-like compression/divergence zones.
• Volatility Filter: Measures ATR and Elastic Divergence to give you the strength of the movement.
⸻
📊 In short:
Your indicator isn't just one; it's a complete suite of tools:
• Smart Buy/Sell Signals +
• Trend and Cloud + EMA200
• Reversal and Saturation Signals
• Dashboard for Multi-Timeframe Analysis
• Capital Management with Targets and Stops
僅限邀請腳本
僅作者批准的使用者才能訪問此腳本。您需要申請並獲得使用許可,通常需在付款後才能取得。更多詳情,請依照作者以下的指示操作,或直接聯絡aymankhsara2022。
TradingView不建議在未完全信任作者並了解其運作方式的情況下購買或使用腳本。您也可以在我們的社群腳本中找到免費的開源替代方案。
作者的說明
The Whale Indicator is designed to detect large liquidity movements (whales) in the market.
It features accurate entry and exit signals and draws support and resistance levels based on smart capital activity.
It helps you filter out false signals and spot
免責聲明
這些資訊和出版物並非旨在提供,也不構成TradingView提供或認可的任何形式的財務、投資、交易或其他類型的建議或推薦。請閱讀使用條款以了解更多資訊。