INVITE-ONLY SCRIPT
已更新 Renko MACD Trend

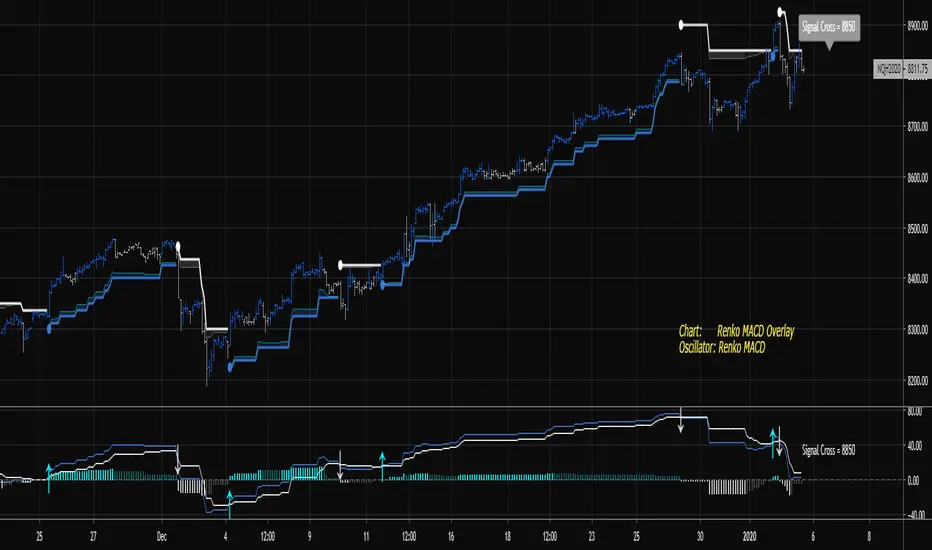
The goal of this indicator is to plot the MACD, Signal, and Histogram values "as if" the chart is a true price action based Renko chart. It can be used on a time series chart or Renko series chart. The MACD is derived from the raw price action of a time-based chart, where the historic and live price is clustered into Renko bricks. The Renko brick production algorithm is entirely backed by Renko Overlay Ribbon and thoroughly tested.
The algorithm takes into account rapid brick production within a single time candle and adjusts accordingly. The output may vary slightly between different chart time frames for the same indicator settings, but this is due to the lack of price fluctuation visibility that can occur in higher chart time frames. If the brick tick size is low, an appropriate chart interval should be selected that maximizes the amount of price volatility visible to the indicator. A bad setting would be something like a 1 tick EURUSD Renko setting on an H4 or Day chart, there simply is no way to derive the exact and ordered price fluctuations in a single candle, 1 pip at a time. A more appropriate chart time frame would be 1-5 minutes for this selected Renko brick size.
The difference between this indicator and the companion Renko MACD indicator can be understood in the following video. The indicator plots the current MACD - Signal cross and MACD - Zero cross thresholds on the chart so that you know exactly where the most important crossing values are at all times. This can be used as a dynamic stop or a dynamic entry location for trades.

If you are interested in the RSI-RENKO DIVINE Strategy please have a look here:

Contact me in Trading View or telegram for more information and access instructions.
Telegram: t.me/mortdiggiddy
Daily Edge: daily-edge.com
The algorithm takes into account rapid brick production within a single time candle and adjusts accordingly. The output may vary slightly between different chart time frames for the same indicator settings, but this is due to the lack of price fluctuation visibility that can occur in higher chart time frames. If the brick tick size is low, an appropriate chart interval should be selected that maximizes the amount of price volatility visible to the indicator. A bad setting would be something like a 1 tick EURUSD Renko setting on an H4 or Day chart, there simply is no way to derive the exact and ordered price fluctuations in a single candle, 1 pip at a time. A more appropriate chart time frame would be 1-5 minutes for this selected Renko brick size.
The difference between this indicator and the companion Renko MACD indicator can be understood in the following video. The indicator plots the current MACD - Signal cross and MACD - Zero cross thresholds on the chart so that you know exactly where the most important crossing values are at all times. This can be used as a dynamic stop or a dynamic entry location for trades.

If you are interested in the RSI-RENKO DIVINE Strategy please have a look here:

Contact me in Trading View or telegram for more information and access instructions.
Telegram: t.me/mortdiggiddy
Daily Edge: daily-edge.com
發行說明
- Updated member features.
發行說明
- Updated data gap algorithm.
- Added renko band display option.
- Added bar coloring options.
- Updated alerts.
發行說明
- Updated member features.
- Added option to choose different types of display settings for Renko Source, identical to Renko Dynamic Index Zones.
僅限邀請腳本
僅作者批准的使用者才能訪問此腳本。您需要申請並獲得使用許可,通常需在付款後才能取得。更多詳情,請依照作者以下的指示操作,或直接聯絡mortdiggiddy。
TradingView不建議在未完全信任作者並了解其運作方式的情況下購買或使用腳本。您也可以在我們的社群腳本中找到免費的開源替代方案。
作者的說明
Find the edge.
Website: daily-edge.com
Twitter: twitter.com/dailyEdgeGroup
Youtube: youtube.com/c/TheDailyEdgeTradingGroup
Telegram: t.me/mortdiggiddy
Paypal: paypal.me/mortdiggiddy
Website: daily-edge.com
Twitter: twitter.com/dailyEdgeGroup
Youtube: youtube.com/c/TheDailyEdgeTradingGroup
Telegram: t.me/mortdiggiddy
Paypal: paypal.me/mortdiggiddy
免責聲明
這些資訊和出版物並非旨在提供,也不構成TradingView提供或認可的任何形式的財務、投資、交易或其他類型的建議或推薦。請閱讀使用條款以了解更多資訊。