945
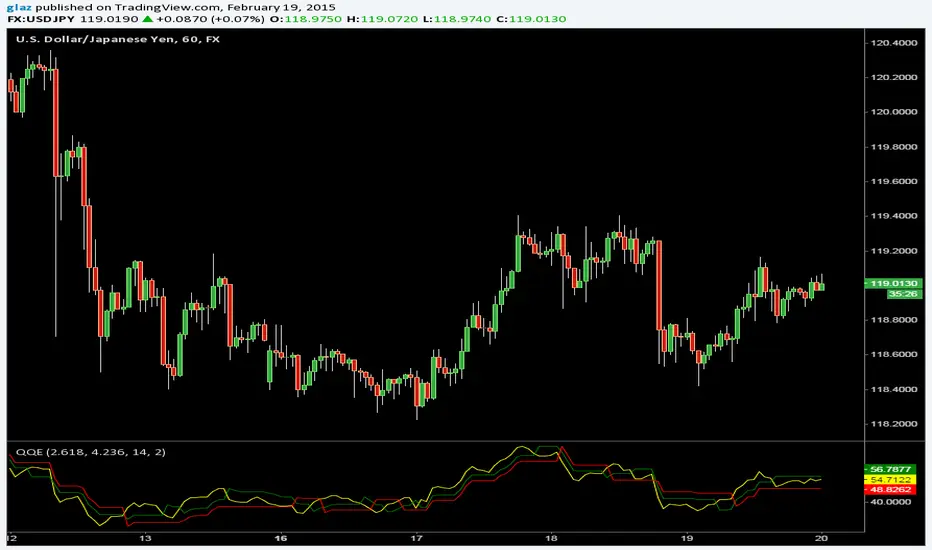
The Metastock version of Quantative Qualitative Estimation with two trailing stop lines and more options
Yellow line can be hidden if its too many signals and expirement with the Slow/Fast Trailing stop lines.
開源腳本

本著真正的TradingView精神,該腳本的作者將其開源發布,以便交易者可以理解和驗證它。為作者喝彩吧!您可以免費使用它,但在出版物中重複使用此代碼受網站規則的約束。 您可以收藏它以在圖表上使用。

免責聲明

這些資訊和出版物並不意味著也不構成TradingView提供或認可的金融、投資、交易或其他類型的意見或建議。請在使用條款閱讀更多資訊。

想在圖表上使用此腳本?
//By Glaz Metastock Version of QQE
study("QQE")
src=close
Fast=input(2.6180)
Slow=input(4.2360)
RSI=input(14)
SF=input(2,title='Slow Factor')
WiMA(src, length) => 
    MA_s=(src + nz(MA_s[1] * (length-1)))/length
    MA_s

RSIndex= ema(rsi(close,RSI), SF)

//{Smoothed ATR of Smoothed RSI}
TH= iff(RSIndex[1] > RSIndex, RSIndex[1], RSIndex)
TL= iff(RSIndex[1] < RSIndex, RSIndex[1], RSIndex)
TR= TH-TL

AtrRsi= WiMA(TR, 14)
SmoothedAtrRsi= WiMA(AtrRsi, 14)

//{Fast and Slow ATR Trailing Levels} 

DeltaFastAtrRsi= SmoothedAtrRsi*Fast

newshortband=  RSIndex + DeltaFastAtrRsi
newlongband= RSIndex - DeltaFastAtrRsi
longband=RSIndex[1] > longband[1] and RSIndex > longband[1]?
 max(longband[1],newlongband):newlongband
shortband=RSIndex[1] < shortband[1] and  RSIndex < shortband[1]?
 min(shortband[1], newshortband):newshortband
trend=cross(RSIndex, shortband[1])?1:cross(longband[1], RSIndex)?-1:nz(trend[1],1)
FastAtrRsiTL = trend==1? longband: shortband

DeltaSlowAtrRsi= SmoothedAtrRsi*Slow

newshortband1=  RSIndex + DeltaSlowAtrRsi
newlongband1= RSIndex - DeltaSlowAtrRsi

longband1=RSIndex[1] > longband1[1] and RSIndex > longband1[1]?
 max(longband1[1],newlongband1):newlongband1
shortband1=RSIndex[1] < shortband1[1] and  RSIndex < shortband1[1]?
 min(shortband1[1], newshortband1):newshortband1

trend1=cross(RSIndex, shortband1[1])?1:cross(longband1[1], RSIndex)?-1:nz(trend1[1],1)
SlowAtrRsiTL= trend1==1? longband1: shortband1

plot(RSIndex,title="RSIndex",color=yellow)
plot(FastAtrRsiTL,title="FastAtrRSI",color=green)
plot(SlowAtrRsiTL,title="SlowAtrRSI",color=red)