PROTECTED SOURCE SCRIPT
$TICK & TICKQ Sentiment Indicator
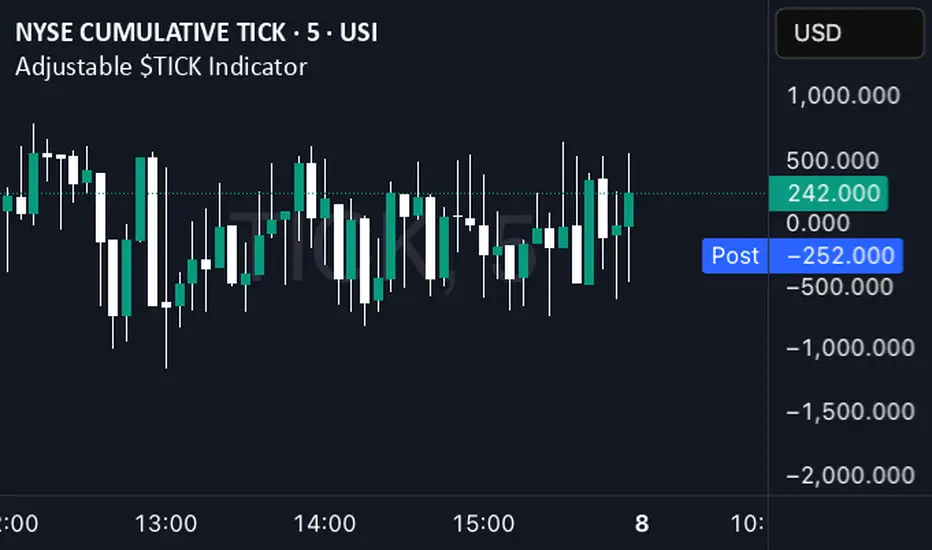
The  TICK & TICKQ Sentiment Indicator is a versatile tool for traders analyzing the NYSE Tick Index (TICK) or Nasdaq Tick Index (TICKQ) to gauge market sentiment. It provides clear visual signals, a customizable moving average, and statistical insights to identify bullish and bearish conditions in real-time.
Key Features:
How to Use:
Notes:
Created by northfieldwhale.
Key Features:
- Sentiment Signals: Green triangle (▲) labels at a user-defined level (default: +1200) when the Tick closes above zero, and red triangle (▼) labels (default: -1200) when below zero, indicating bullish or bearish sentiment.
- Adjustable Moving Average: Plots a customizable moving average (SMA, EMA, WMA, VWMA, SMMA, HullMA) with user-defined length (default: 14) to smooth Tick data and highlight trends.
- Close Statistics: Displays the percentage of positive and negative Tick closes over a user-specified lookback period (default: 100) in a customizable table (position and font size adjustable).
- Threshold Lines: Includes reference lines at +800/-800 (gold) and +1000/-1000 (red) to mark key Tick levels, plus a zero line (gray, dashed) for context.
- Customizable Display: Adjust symbol sizes (tiny, small, normal, large, huge), table position (top-right, top-left, etc.), and table font size for a tailored chart experience.
How to Use:
- Apply the indicator to a TICK or TICKQ chart (e.g., TVC:TICK, TVC:TICKQ) on an intraday timeframe (e.g., 1-minute, 5-minute).
- In the settings:
- Set the TICK Symbol to your broker’s NYSE Tick (USI:TICK) or Nasdaq Tick (USI:TICKQ) symbol.
- Adjust Top Level and Bottom Level (default: +1200/-1200) to position sentiment signals at chart edges.
- Set Moving Average Length and Type to suit your analysis.
- Configure Lookback Period for close percentage calculations.
- Customize Dot Size, Table Position, and Table Font Size for optimal visibility. - Monitor green/red triangles for sentiment, the moving average for trends, and the table for statistical insights.
Notes:
- This indicator is designed for both TICK (NYSE Tick) and TICKQ (Nasdaq Tick, NQ Tick), allowing analysis of either market’s breadth.
- Ensure your chart’s timeframe supports TICK or TICKQ data.
- Adjust Top Level/Bottom Level if symbols don’t appear at chart edges due to scaling.
- Labels may stack with frequent signals.
- No symbol appears if the Tick closes at 0; a neutral marker.
- Day traders and scalpers using TICK or TICKQ to gauge market breadth.
- Analysts seeking customizable visualizations and statistical insights for Tick data.
Created by northfieldwhale.
受保護腳本
此腳本以閉源形式發佈。 不過,您可以自由使用,沒有任何限制 — 點擊此處了解更多。
免責聲明
這些資訊和出版物並非旨在提供,也不構成TradingView提供或認可的任何形式的財務、投資、交易或其他類型的建議或推薦。請閱讀使用條款以了解更多資訊。
受保護腳本
此腳本以閉源形式發佈。 不過,您可以自由使用,沒有任何限制 — 點擊此處了解更多。
免責聲明
這些資訊和出版物並非旨在提供,也不構成TradingView提供或認可的任何形式的財務、投資、交易或其他類型的建議或推薦。請閱讀使用條款以了解更多資訊。