PROTECTED SOURCE SCRIPT
已更新 R Factor Advanced Stock Activity Ranking (Experimental)
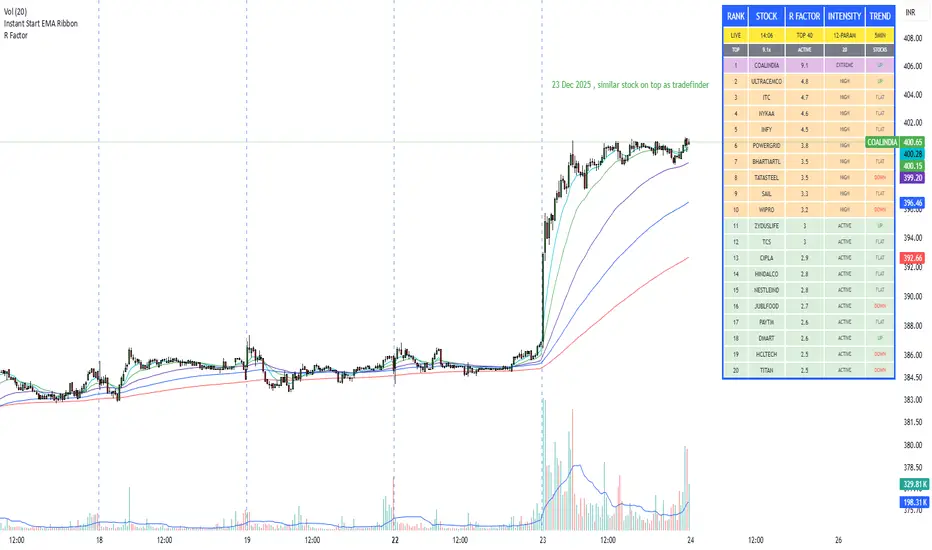
R Factor (relative factor) is a custom logic based 'momentum ranking' parameter, which measures intensity of intraday momentum and volatility. This parameter compared today's activity from last 20 days activity and ranks the stocks according to the intensity of the momentum.
Why momentum ranker?
Because traditional %change sorts intraday stock which show momentum in ascending order of value of % change, for example 3%, 2.5 %, 1% etc. But momentum ranker does not use % change as a sorting parameter for top gainers, or losers. It ranks the stocks, regardless of the direction, according to the intensity it is showing. The value of the momentum ranking has no meaning of itself, just understand that higher the value of momentum ranker, the more intensity the stock is showing.
In this indicator we can only scan 40 F&O stock of Indian Stock Market. This indicator is to be used only on 5 min timeframe.
Tip: Do not change any values in the settings otherwise, the indicator won't work as expected.
Also after applying the indicator, your canvas will shrink, manually fix it by stretching from Y axis, a table will appear showing top 20 stocks. Some times the indicator will glitch & show incorrect names of stocks, refresh the Tradingview website to fix this. Best used on a PC.
Disclaimer/Warning:
This parameter is inspired by TradeFinder and is an attempt to study the momentum of the stocks. This indicator in no way attempts to copy features of the TradeFinder software, this is purely an experimental Indicator, for the people who cannot afford to buy a trading software. This indicator does not provide Buy/Sell signals or nor is an investment advice. This indicator solely for the purpose of study of price and its momentum. Users are responsible for their own actions, profit/loss of the users is not the liability of author.
發行說明
Optimized the code.You can turn off the scale factor line from indicator settings which used to mess up canvas earlier.
受保護腳本
此腳本以閉源形式發佈。 不過,您可以自由使用,沒有任何限制 — 點擊此處了解更多。
免責聲明
這些資訊和出版物並非旨在提供,也不構成TradingView提供或認可的任何形式的財務、投資、交易或其他類型的建議或推薦。請閱讀使用條款以了解更多資訊。
受保護腳本
此腳本以閉源形式發佈。 不過,您可以自由使用,沒有任何限制 — 點擊此處了解更多。
免責聲明
這些資訊和出版物並非旨在提供,也不構成TradingView提供或認可的任何形式的財務、投資、交易或其他類型的建議或推薦。請閱讀使用條款以了解更多資訊。